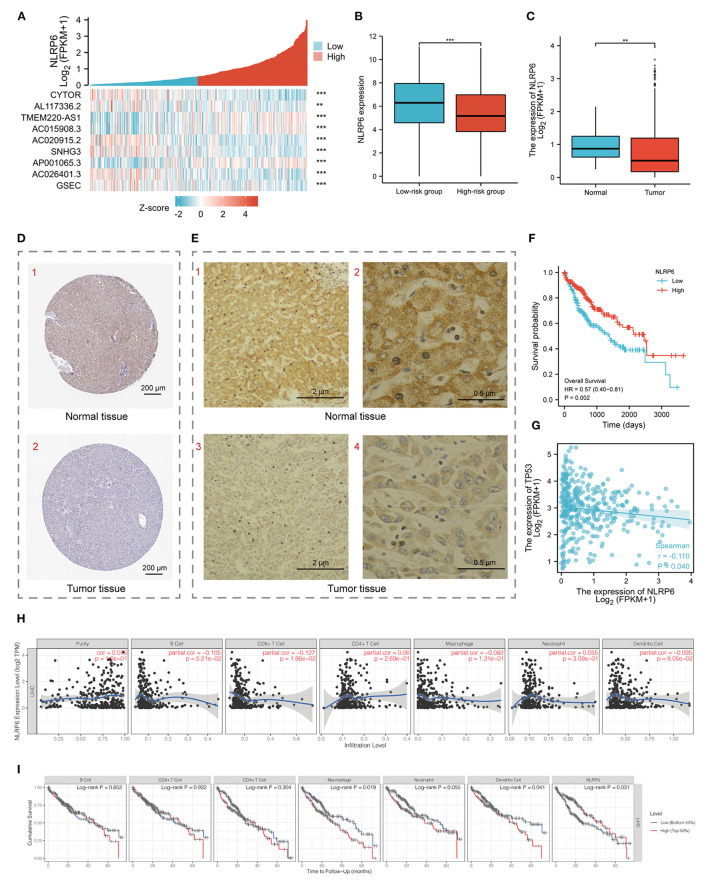
Figure 6.
(A) Heatmap for the co-expression of 9 pyroptosis-related prognostic lncRNAs with NLRP6. (B) Histogram for NLRP6 mRNA different expression between low-and high-risk groups. (C) Histogram for NLRP6 different expression between normal and tumor tissues based on LIHC-TCGA database. (D) Validation of the expression of NLRP6 on the translational level by the Human Protein Atlas database (immunohistochemistry, IHC), scale bar = 200 μm. (E) Representative IHC images for NLRP6 performed on the tissues from one HCC patient. (1, 3) Scale bar = 2 μm, (2, 4) scale bar = 0.5 μm. (F) Kaplan-Meier survival curves for the overall survival (OS) based on low/high expression of NLRP6 separated by the median expression. (G) Bubble graph for the co-expression of NLRP6 and TP53. (H) Relationship between NLRP6 expression and infiltration levels of immune cells in HCC via the TIMER database. (I) Kaplan-Meier curves revealed the immune infiltration and overall survival rate of HCC. **P < 0.01, ***P < 0.001.

