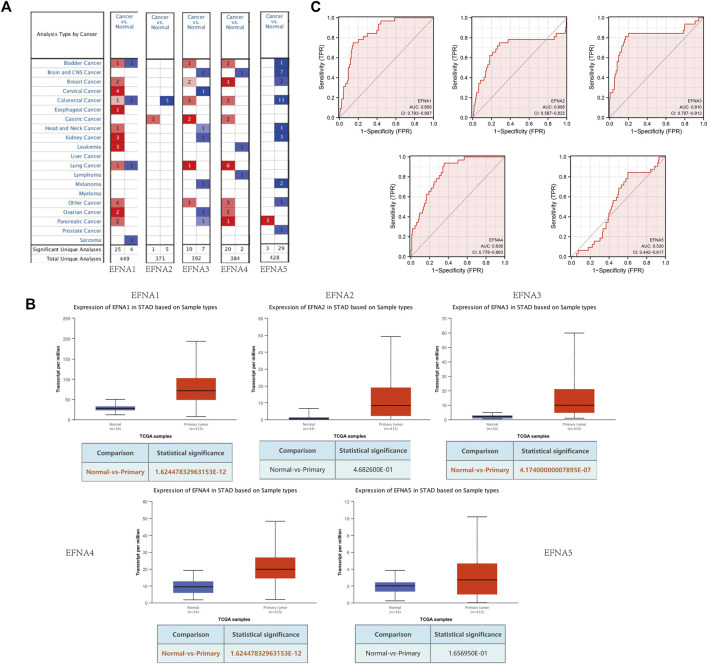
FIGURE 1.
Expression of EFNA1-5 in gastric cancer and normal tissues. (A) mRNA levels of EFNA in various cancers. Red represents up-regulated mRNA expression and blue represents down-regulated mRNA expression. (B) Transcription of EFNA1-5 in gastric cancer and normal tissues from UALCAN data. (C) ROC curves of the EFNA genes.

