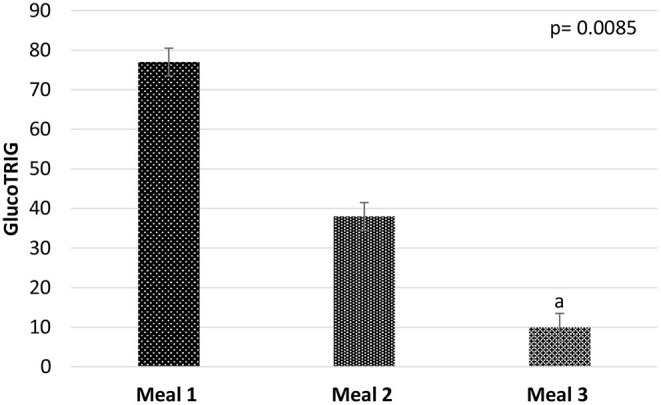
Figure 2.

Mean GlucoTRIG values of the meals M1 (n = 10), M2 (n = 10), and M3 (n = 10). Data presented as mean ± SEM. P-value represents the repeated measures of ANOVA between the meal groups in a model. aGlucoTRIG value of Meal 3 is significantly differnet from meal 1 (p = 0.012).
