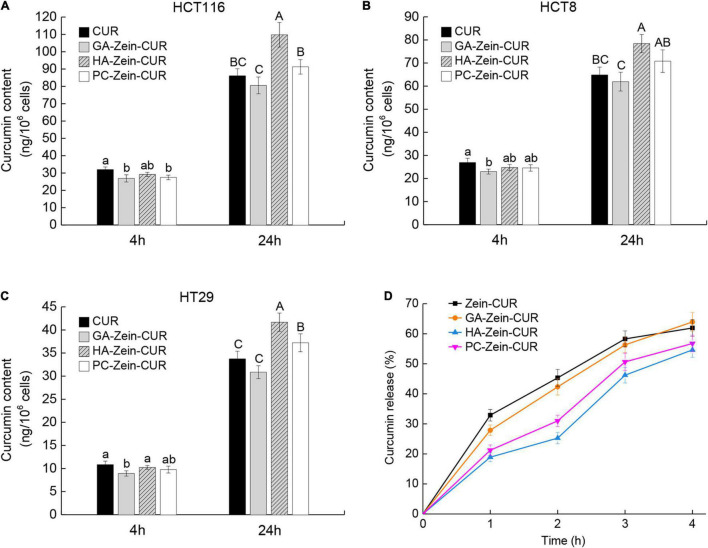
FIGURE 5.
Cellular uptake and simulated gastrointestinal digestion (SDIG) of PS-Zein-CUR. (A–C) CUR contents in CRC cells incubated, respectively with CUR and PS-Zein-CUR for 4 and 24 h. Values are mean ± SD, n = 3. Bars marked with different letters indicate significant difference at P < 0.05. (D) CUR release from Zein-CUR and PS-Zein-CUR during SDIG. Values are mean ± SD, n = 3.

