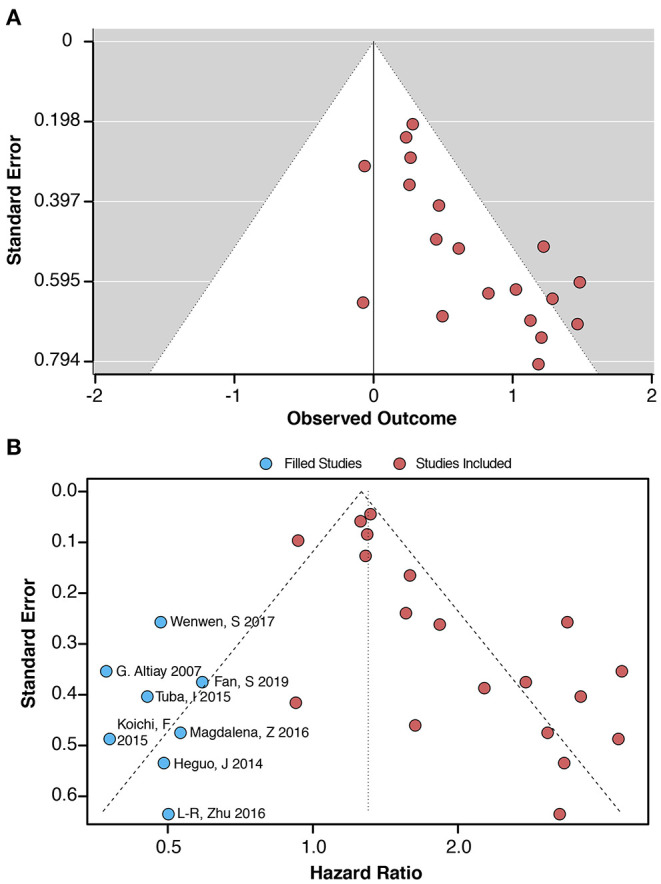
Figure 3.

(A) Funnel plot for the link between plasma D-dimer levels (highest vs. lowest category) and lung cancer-associated mortality. (B) Filled funnel plot and meta trim-and-fill model. The blue dots indicate that these included studies require a corresponding study for correction, thus reducing bias.
