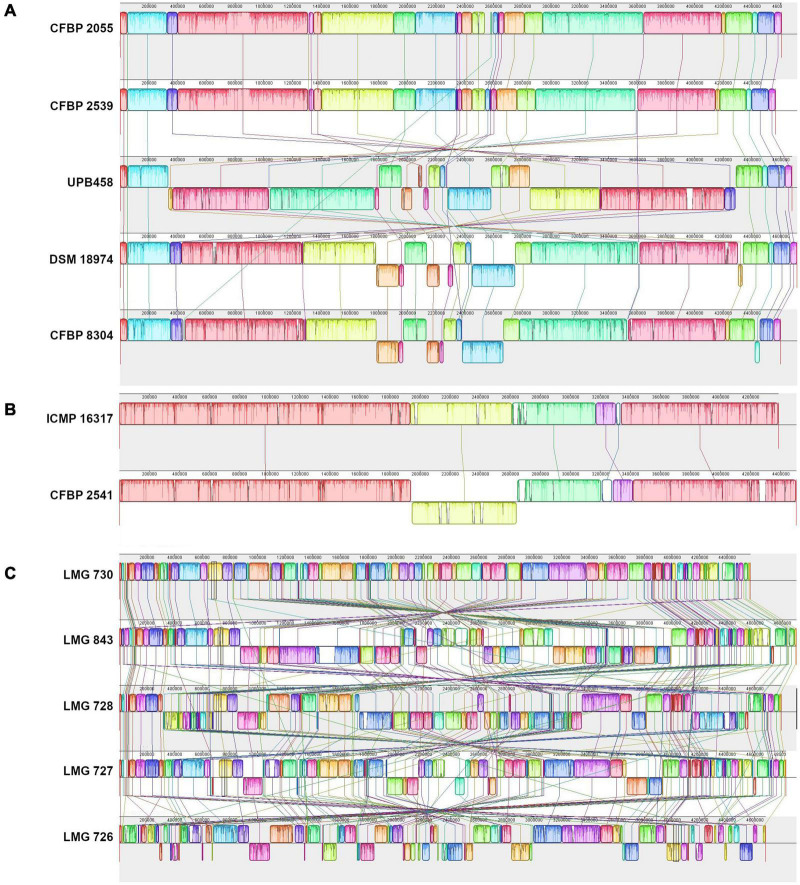
FIGURE 2.
Pairwise comparisons of the genomic structure within the three X. translucens clades with progressive Mauve (Darling, 2004). (A) Clade Xt-I, (B) clade Xt-II, (C) clade Xt-III. Colors represent conserved genomic regions (locally collinear blocks, LCBs), i.e., regions with no rearrangement across all the compared genome sequences. Lines between strains link LCBs that are orthologous between two genome sequences. LCBs found on the bottom part represent regions that are in reverse orientation compared to the reference. In each comparison, the sequence on top is used as reference.

