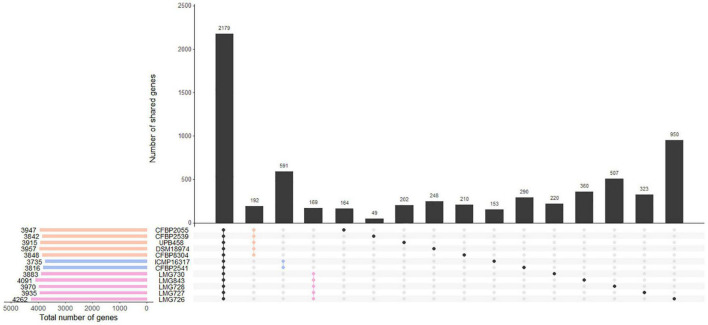
FIGURE 3.
Gene content of the 12 X. translucens pathotype strains used in this study. Vertical bars show the number of genes exclusive to the strains marked in the matrix below. The first group represents the core genome of the species. The second, third, and fourth groups represent genes that are exclusive to the three clades, as indicated by their respective color. Other groups represent genes that are exclusive to one strain. Horizontal bars show the total number of genes in each strain. Orange: clade Xt-I, blue: clade Xt-II, pink: clade Xt-III.

