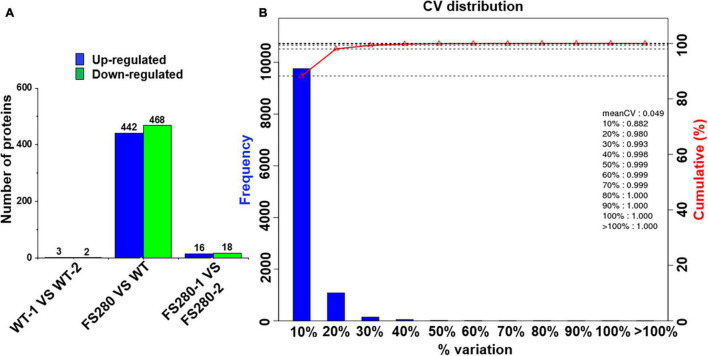
FIGURE 4.
Protein quantification in C. cohnii. (A) Histogram of differentially expressed proteins. (B) Distribution of the CV (coefficient of variation) in replicates. The CV is defined as the ratio of the standard deviation to the mean. The X-axis represents the deviation among the protein ratios of the repetitive samples. The Y-axis represents the percentage of proteins at a certain angle that comprised the quantified amount of protein.

