Figure 3.

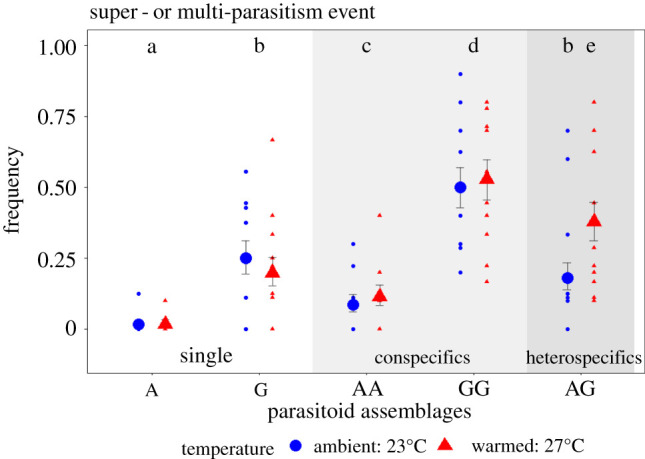
Frequency of super- or multi-parasitism events out of the total of parasitized hosts per vial (n = 100 vials) significantly changed depending on parasitoid assemblage and temperature regime, indicating changes in intrinsic competitive interaction strength among parasitoids. Within each plot, different small letters denote significant differences between parasitoid assemblages (and temperature regime if significant). White panel, single parasitoid; light grey panel, two parasitoids conspecific; darker grey panel, two parasitoids heterospecific. Parasitoid abbreviations: A, Asobara sp.; and G, Ganaspis sp. Big dots represent the estimated means (±95% CIs) and small dots represent raw data. (Online version in colour.)
