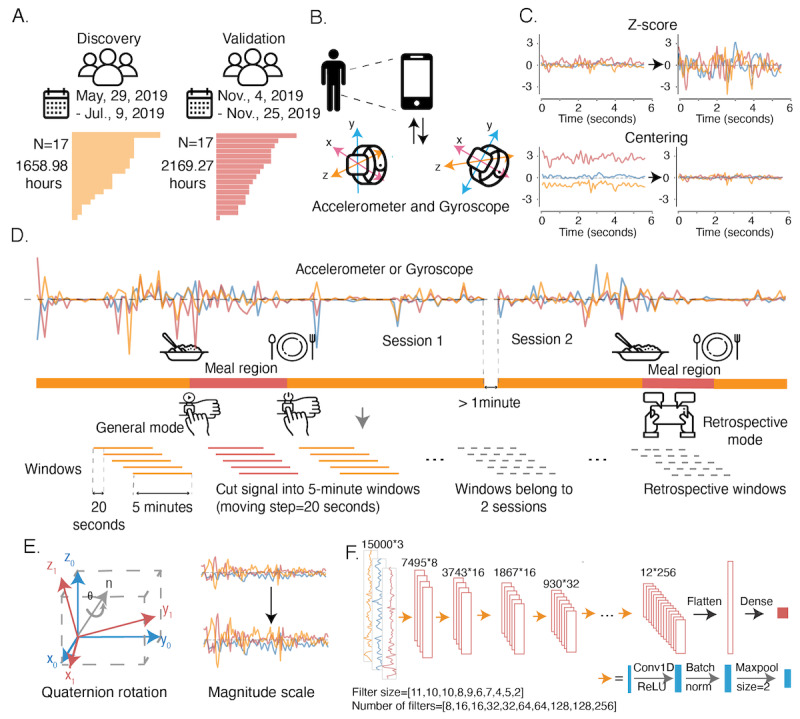
Figure 1.

Overview of data collection and streaming for meal activity analysis. (A) Data comes from two cohorts: 17 participants in the discovery cohort with 1658.98 hours of data and 17 participants in the validation cohorts with 2169.27 hours of data. (B) Signals were collected by 2 sets of sensors, accelerometer and gyroscope, in Apple Watch and paired with iPhone. (C) Z score and centering normalization were conducted for each of the x, y, and z axes for each window. (D) The gyroscope and accelerometer provide continuous signals on the x, y, and z axes over time. There are 2 modes to record meal time. The general model recording starts and stops by tapping the button on the Apple Watch. Retrospective mode allows the participant to type in the rough meal time with the iPhone after having a meal. For each record, we took 5-minute windows with a moving step of 20 seconds. The windows with >2.5 minutes of mealtime will be labeled as eating activity. Windows belonging to 2 sessions are removed. (E) Two augmentation methods, quaternion rotation and scaling the signal magnitude, apply to each data window. (F) Deep learning network structure.
