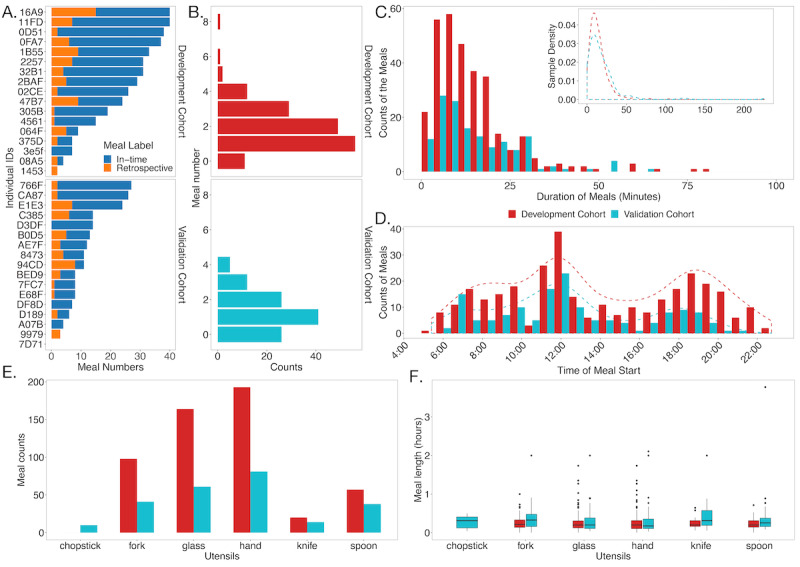
Figure 2.

Summary of the meal regions. (A) Describes the meal number of each individual in the discovery cohorts and the validation cohorts. The bars are sorted by the total number of the meals and comprise two types of model labeling: label during eating (in-time, the blue bars) and label by retrospect (retrospective, the orange bars). (B) Summarizes the meal numbers per day excluding the retrospectives. (C) Shows the distributions of the duration (in minutes) of the meals for the discovery and the validation cohorts, excluding the retrospective meals. (D) Plots the distributions of the starting times of the meals in these 2 cohorts, and the dashed lines correspond to smoothed curves describing the counts. (E) Distribution of the numbers of the meals with different utensils in the discovery and the validation cohorts. (F) Statistics of the meal lengths (in hours) for different utensils in the discovery and the validation cohorts.
