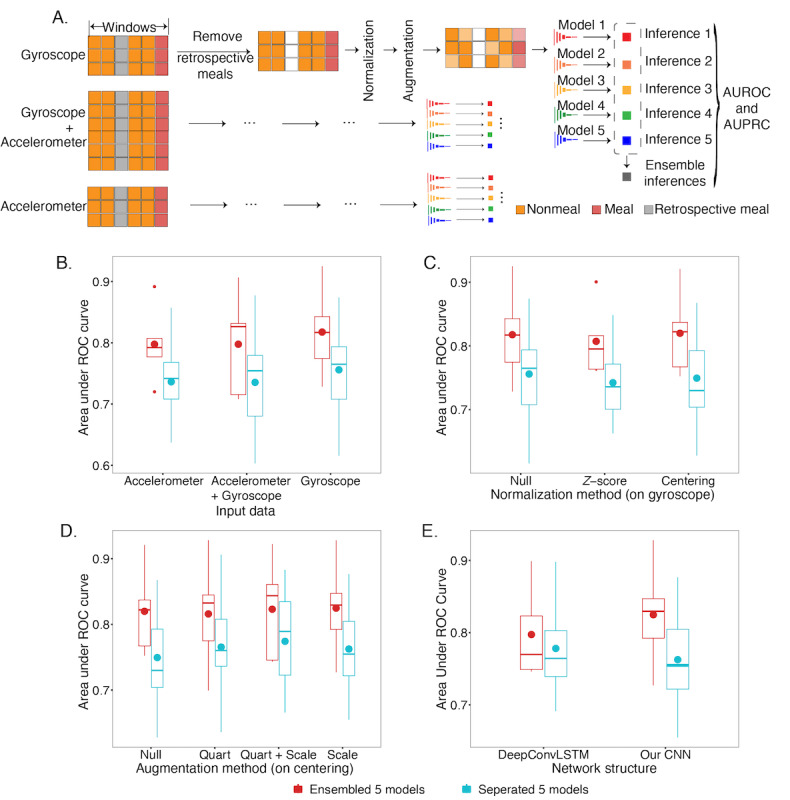
Figure 3.

Evaluation of model performance on 5-minute windows of the discovery cohort. (A) Models were built by gyroscope data only, accelerometer data only, and gyroscope+accelerometer data. Next, we tested the centering and normalization of each axis of the data. Intensive data augmentation was applied to the data on the fly. For each method, 5 models were trained by resampling the training and validation data and they were assembled for evaluation. (B) Presents the performance comparisons of different data selections. (C) Presents the performance comparison of different normalization methods applied on the gyroscope model. (D) Presents the performance comparisons of the augmentation methods based on the centering model, where Quart refers to the quaternion rotation augmentation, and Scale refers to scaling the magnitude. (E) Comparison of the performances between DeepConvLSTM and the method presented in this paper. AUROC: area under the ROC curve; AUPRC: area under the precision–recall curve; CNN: convolutional neural network; ROC: receiver operator characteristic.
