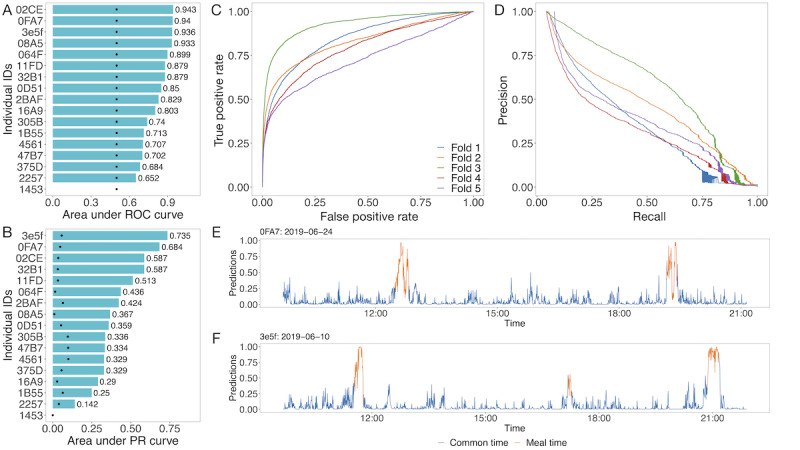
Figure 4.

The evaluations of the selected best model: convolutional neural network backbone trained with the centering normalized gyroscope data using magnitude scaling. (A and B) show the leave-one-subject-out results of the model on the discovery cohort, evaluated both in the area under the curves and area under the precision–recall curves. The black points in (B) are the baselines for the individuals. As 1453 does not have any positive samples after excluding the retrospectives, its value will be empty. (C) is an area under the ROC curve, and (D) is a precision–recall curve for the cross-validation from the ensemble model, respectively. (E and F) give the inferences of the 2 dates of records, where the blue segments denote the signals of the non–meal time, and the orange segments are the signals of the mealtime. PR: precision recall; ROC: receiver operator characteristic.
