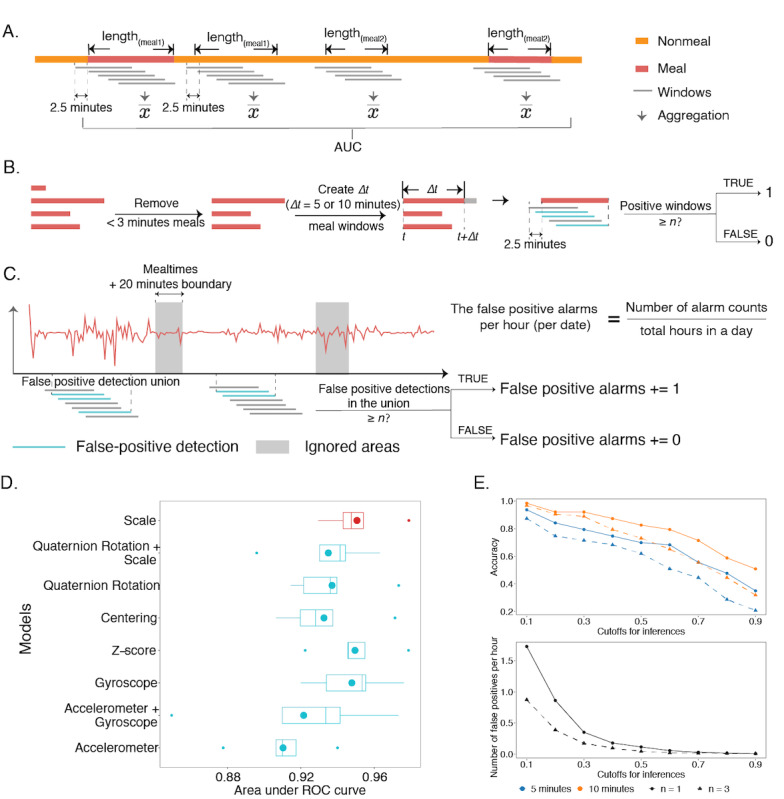
Figure 6.

The results of the aggregations on the entire meals and on the specific time regions after meal start. (A) Aggregation to produce meal-level detection performance. (B) A preprocessing step removed meals that were <3 minutes and created 5- or 10-minute windows for positive examples to evaluate recall rate. (C) Nonmeal regions were used to calculate false positive alarms using the 5-minute windows and the same criteria as what was used to define positive inferences in calculating the recall rate. The gray areas denote the mealtimes with the 10-minute boundaries at the start and the end, where the windows are out of consideration. (S) Shows the evaluations of the aggregations on the entire meals. The boxplots comprise the AUCs from the average inferred scores of the ensemble models in the cross-validation, and the experiments (models) are the same as those in Figure 3A. The point in each box denotes the corresponding average AUC. (E) indicates the results of the aggregation on the 5- and 10-minute meals after starting and on the entire negative signals. The lines show how the detection accuracy and the hourly false positive numbers (the black lines) change along with the cutoffs. The orange lines show the results for the 10-minute meals, and the blue lines are the 5-minute meals. The shape of the points represents the choice of N, where the circles/solid lines are N=1, and the triangles/dashed lines are N=3. AUC: area under the curve; ROC: receiver operator characteristic.
