Figure 1. .
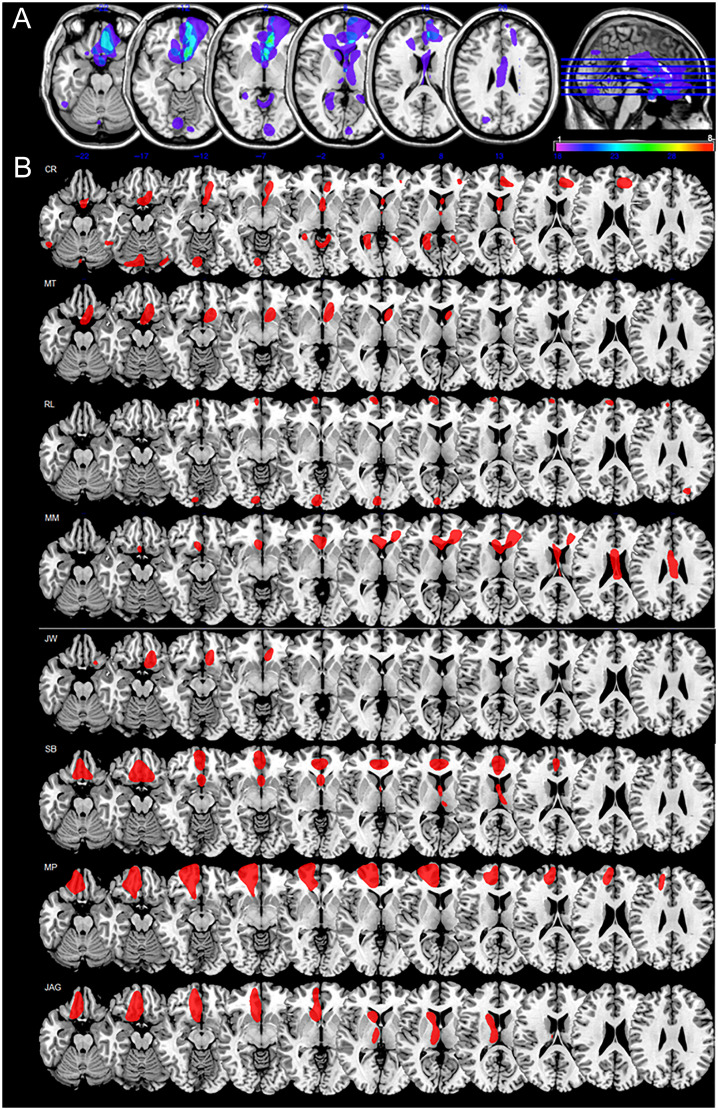
Lesion location and extent in vmPFC patients. (A) Axial slice template illustrating lesion overlap across vmPFC patients. Slices are 8 mm apart at z = −30, −22, −14, −6, +2, and +10, with level of slice depicted in the sagittal reference image. The color bar indicates the number of patients with damage to a particular area, with purple representing regions damaged in only one patient and red representing regions damaged in all eight patients. The image was created using MRIcro software (Chris Rorden; www.psychology.nottingham.ac.uk/staff/cr1/mricro.html). (B) Axial slice templates illustrating the lesion location and extent for each of the vmPFC patients. Slices are 8 mm apart at z = −22, −17, −12, −7, −2, +3, +8, +13, +18, +23, +28. Neurological convention is followed (left hemisphere presented on the left). Details of lesion location and size are provided in the article, and etiology, demographic information, and neuropsychological profiles are presented in Table 1.

