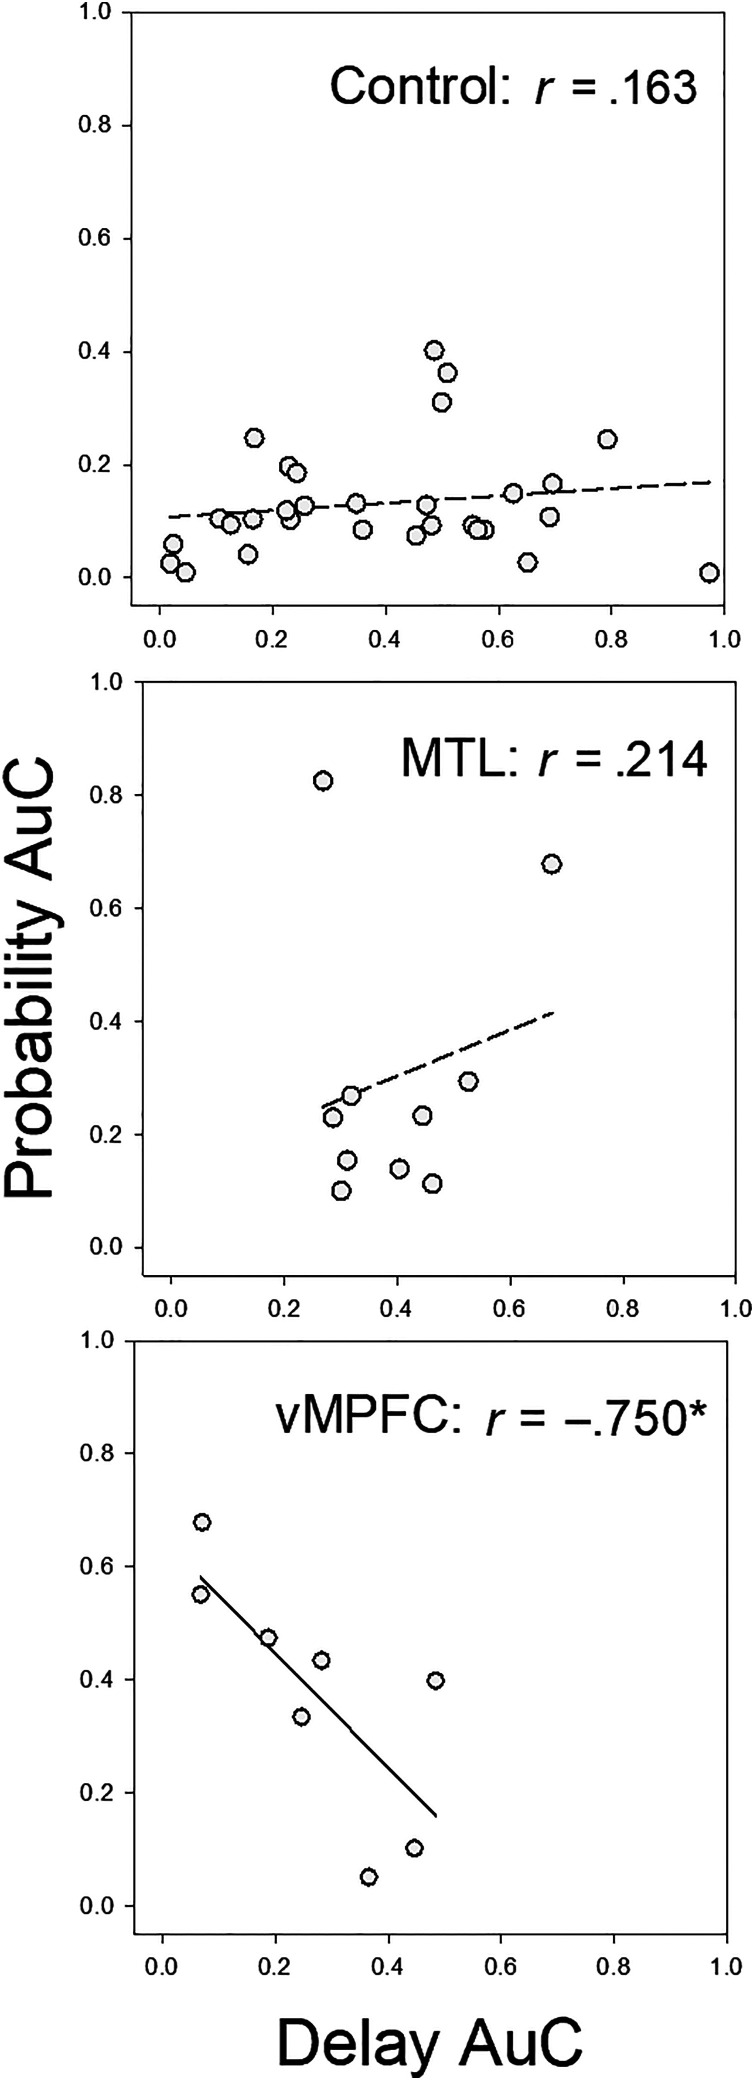
Figure 6. .
Individual mean AuCs (averaged across the two amount conditions) for the delay discounting task, plotted as a function of their mean AuCs for the probability discounting task. Data for the control group are shown in the top, data for the MTL group are shown in the middle, and data for the vmPFC group are shown in the bottom.

