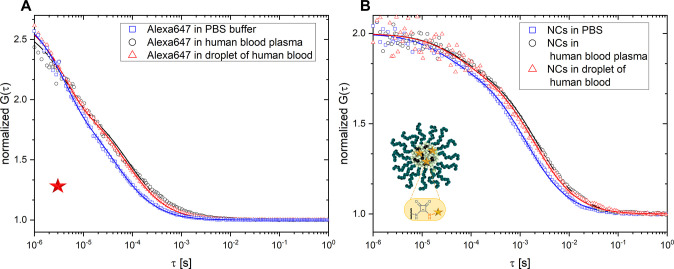
Figure 2.
Initial tests of the FCS in a blood droplet method. (A) Normalized autocorrelation curves for Alexa 647 measured in a droplet of heparin-treated human blood (red triangles), human blood plasma (black circles), and PBS (blue squares). (B) Normalized autocorrelation curves for squarogel NCs measured in a droplet of heparin-treated human blood (red triangles), human blood plasma (black circles), and PBS (blue squares). The solid lines represent the corresponding fits obtained from eq 1.

