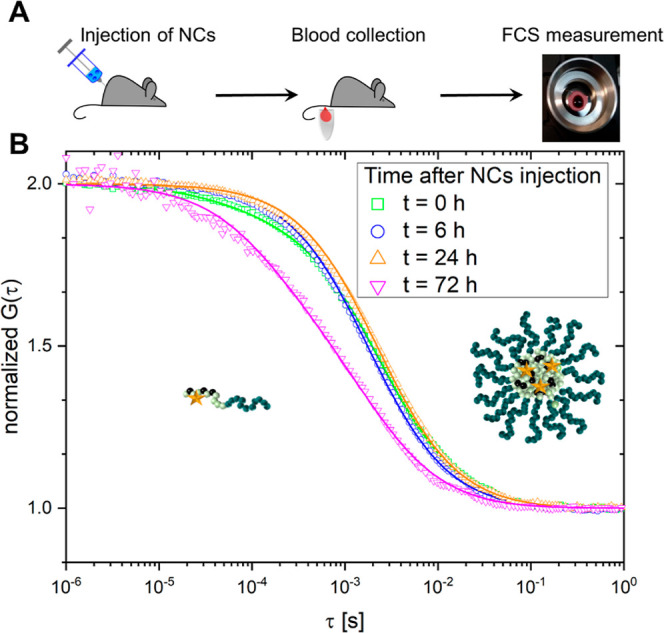
Figure 3.

Monitoring the fate of squarogel NCs in the blood stream after intravenous injection into a mouse. (A) Schematic overview of the experimental procedure. (B) Normalized autocorrelation curves recorded in blood samples taken from a mouse 0 (green), 6 (blue), 24 (orange), and 72 h (magenta) after injection of NCs.
