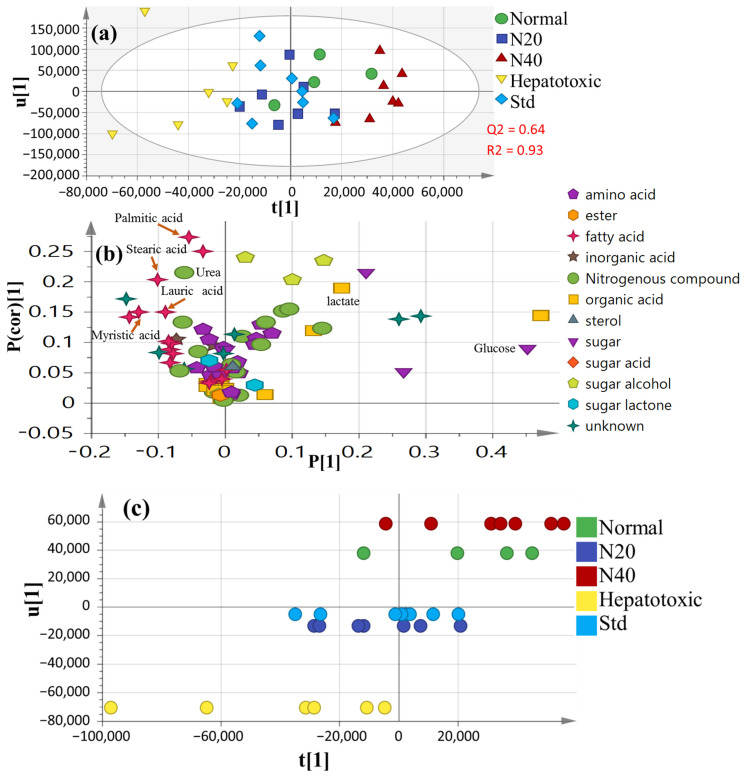
Figure 5.
Supervised OPLS dataset for all groups (n = 6): (a) OPLS-DA score plot; (b) The corresponding loading plot demonstrating the covariance P(1) versus the correlation P(cor)(1); (c) OPLS class inner relation with 40 mg naringenin (colored in red), showing a close relation to the normal untreated group (colored in green). N20: naringenin at 20 mg/kg; N40: naringenin at 40 mg/kg; Std: standard drug (silymarin).

