
Figure 2: An illustration of the 95% reference interval estimated by the mixture distribution method:
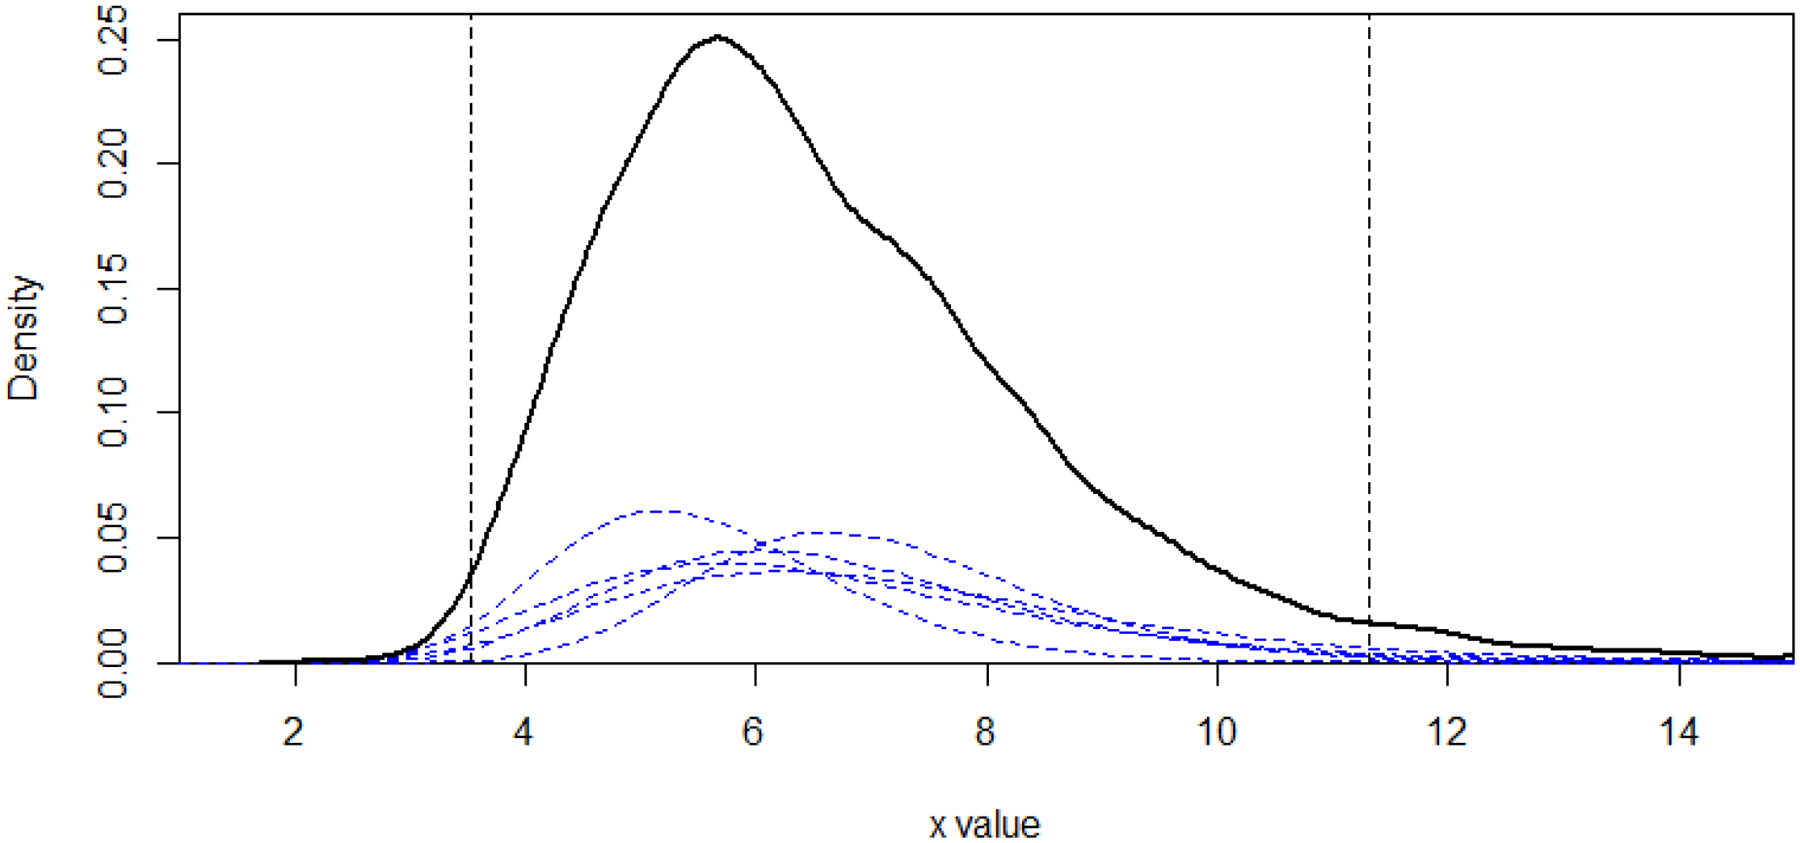
The blue dashed curves are the estimated densities for 5 studies weighted by the sample sizes, and the solid black curve represents the pooled population distribution density. The 95% reference interval is the region of x-axis between two vertical lines, and the sum of area under each blue curve outside the vertical line on each side is equal to 0.025