Figure 4.
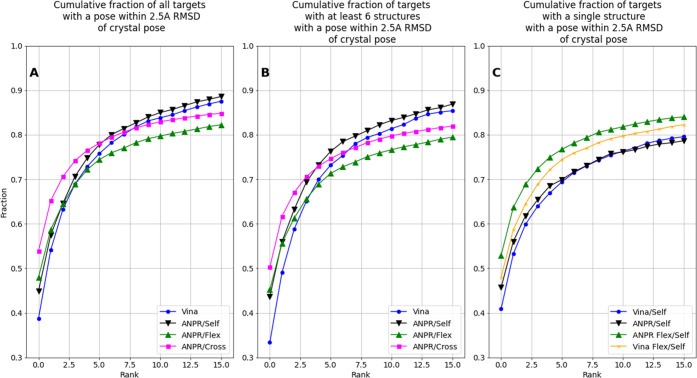
Comparison of pose ranking performances. Cumulative fraction of targets with docked poses within 2.5 Å RMSD of the crystal pose across all receptors within a target class by pose rank for the seqsim50 split according to vina (blue), ANPR trained on self-docked crystal structures (black), ANPR trained on cross-docked crystal structures (pink), and ANPR trained on sampled conformational ensembles (green). Each figure shows the top 16 ranked poses for each docking attempt in A) the full data set and B) targets that include at least six PDB structures, for a direct comparison of experimental and sampled ensembles. C) Models applied to a data set of single receptor conformations for all targets for which only one crystal structure is available. For reference, the vina ranking for the same targets across a six-member sampled ensemble is shown in orange.

