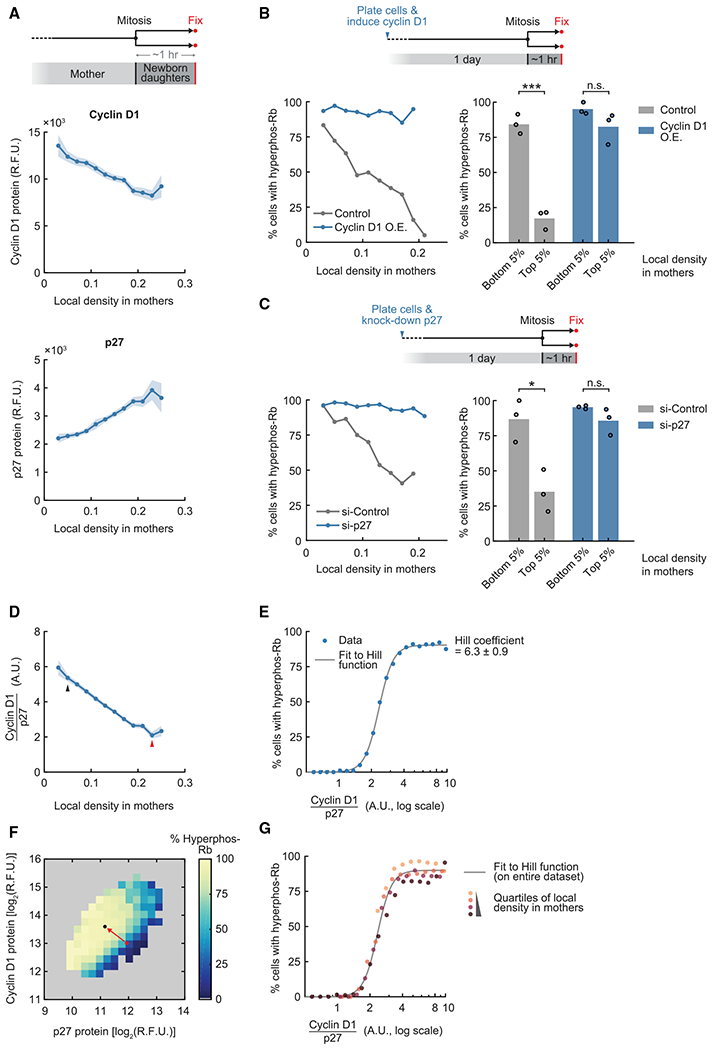
Figure 3. An activator-inhibitor balance between cyclin D1 and p27 directs newborn cells to quiescence.

(A) Top: schematic of the experimental setup. Center: correlation between nuclear cyclin D1 level in newborn cells and local density in mothers. Pearson correlation coefficient, −0.193, p = 2.6 × 10−73. Bottom: correlation between nuclear p27 level in newborn cells and local density in mothers. Pearson correlation coefficient, 0.257, p = 6.2 × 10−130. Line plots are population medians in each bin; shaded error bars are 95% confidence intervals (n ≥ 50 cells per bin, n = 8,574 cells total). Data are representative of 4 independent experiments.
(B) Top: schematic of the experimental setup. Cyclin D1 overexpression (O.E.) was driven by a doxycycline-inducible promoter. Bottom left: correlation of Rb hyperphosphorylation in newborn cells and local density in mothers (n ≥ 20 cells per bin; control, n = 694 cells total; cyclin D1 O.E., n = 973 cells total). Data are representative of 3 independent experiments. Bottom right: percentage of newborn cells with hyperphosphorylated Rb when gating for cells whose mothers experienced different local densities (n ≥ 25 cells per data point). The same gating was used for control and cyclin D1 O.E. Student’s t test; control conditions, p = 2.9 × 10⁻⁴; cyclin D1 O.E. conditions, p = 0.14 (n = 3 independent experiments).
(C) Top: schematic of the experimental setup. Bottom left: correlation of Rb hyperphosphorylation in newborn cells and local density in mothers (n ≥ 25 cells per bin; si-Control, n = 1,063 cells total; si-p27, n = 1,622 cells total). Data are representative of 3 independent experiments. Bottom right: percentage of newborn cells with hyperphosphorylated Rb when gating for cells whose mothers experienced different local densities (n ≥ 28 cells per data point). The same gating was used for si-Control and si-p27. Student’s t test; si-Control conditions, p = 0.014; si-p27 conditions, p = 0.15 (n = 3 independent experiments).
(D) Cyclin D1/p27 ratio in newborn cells as a function of local cell density in mothers (the ratio is expressed in arbitrary units and not indicative of actual stoichiometry; data from A). Pearson correlation coefficient, −0.423, p < 1 × 10−130. Line plots are population medians in each bin; shaded error bars are 95% confidence intervals (n ≥ 50 cells per bin, n = 8,574 cells total). Arrows indicate data points represented by circles in (F). Data are representative of 4 independent experiments. a.u., arbitrary unit.
(E) Percentage of newborn cells with Rb hyperphosphorylation as a function of cyclin D1/p27 ratio (n ≥ 20 cells per bin, n = 8,669 total, data from A). The Hill function was fitted onto the linear scale data. Hill coefficient, 6.3 ± 0.9 (mean ± s.t.d. of 4 independent experiments).
(F) Percentage of newborn cells with Rb hyperphosphorylation as a function of cyclin D1 and p27 protein level (n ≥ 10 cells per bin, n = 8,255 total, data from A). Data are representative of 4 independent experiments.
(G) Percentage of newborn cells with Rb hyperphosphorylation as a function of cyclin D1/p27 ratio after binning cells into quartiles by local density in mothers (n ≥ 20 cells per bin, n ≥ 2,000 total for each quartile, data from A). The Hill curve was fitted to the entire dataset (the same curve as in E).
See also Figure S4.
