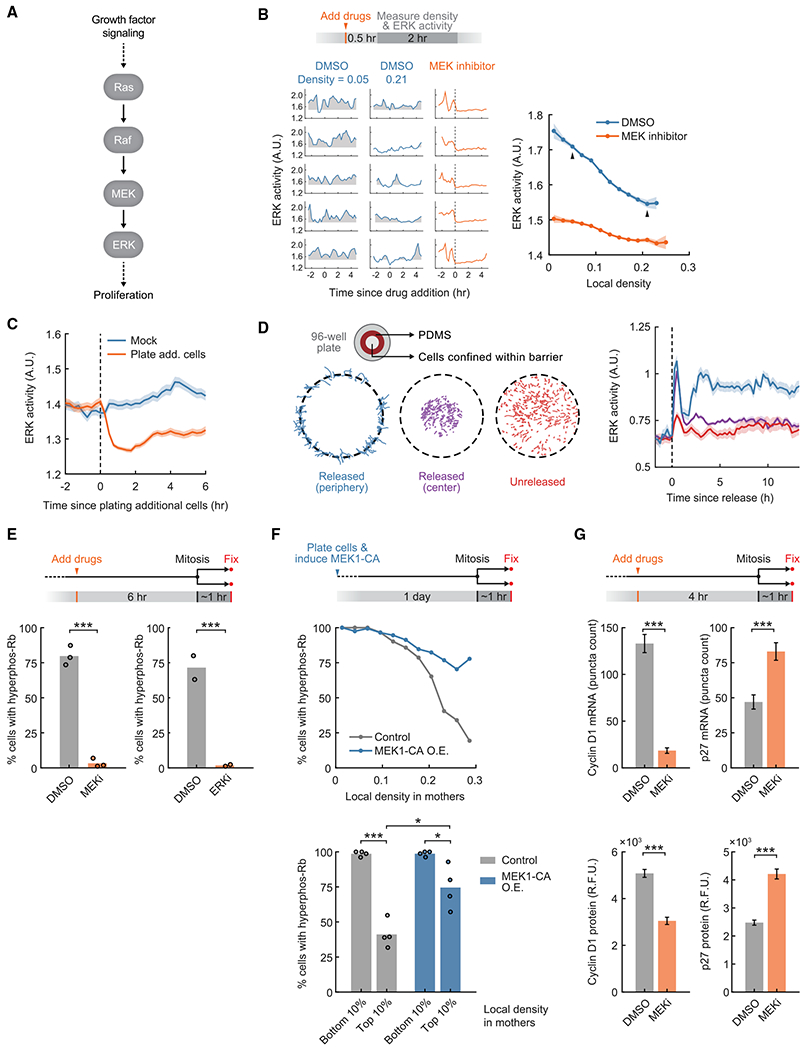
Figure 4. Changes in ERK activity in mother cells control exit to quiescence in newborn cells.

(A) Schematic of the ERK signaling pathway in mammalian cells.
(B) Top: schematic of the experimental setup. ERK activity was measured by the EKAEV-NLS FRET sensor, which was used throughout unless stated otherwise. Bottom left: sample traces of ERK activity at different local density and with DMSO or MEK inhibitor (PD0325901, 100 nM) treatment. Shaded regions indicate ERK activity above baseline (average activity when treated with the MEK inhibitor). Bottom right: correlation between time-averaged ERK activity and local density. Linear regression slope, −1.09 versus −0.41. Arrows indicate data points represented by sample traces. Line plots are population medians in each bin; shaded error bars are 95% confidence intervals (n ≥ 39 cells per bin; DMSO, n = 11,693 cells total; MEK inhibitor, n = 12,447 cells total). Data are representative of 3 independent experiments.
(C) Cell density was acutely increased by plating additional non-fluorescent cells (1.32 × 10⁵ cells/cm2). Line plots are population medians of 140 or more cells; shaded error bars are 95% confidence intervals. Student’s t test comparing ERK activity in mock versus treatment: 15 min before treatment, p = 0.21; 30 min after treatment, p = 1.5 × 10⁻²⁶. Data are representative of 3 independent experiments.
(D) Left: schematic of the experimental setup. Cell traces are shown on the bottom. Right: ERK activity after releasing cells from confinement, measured by the ERK KTR. Line plots are population medians of 92 or more cells; shaded error bars are SEM. Student’s t test comparing ERK activity in released (periphery) versus unreleased cells: 15 min before release, p = 0.29; 3 h after release, p = 8.0 × 10⁻⁸. Data are representative of 2 independent experiments.
(E) Top: schematic of the experimental setup. Bottom: percentage of newborn cells with Rb hyperphosphorylation after inhibition of the MEK-ERK pathway (MEK inhibitor: PD0325901, 100nM; ERK inhibitor: SCH772984, 1 μM) (n ≥ 785 cells per condition). Student’s t test; MEK inhibitor versus DMSO, p = 6.5 × 10⁻⁵ (n = 3 independent experiments); ERK inhibitor versus DMSO, p = 4.4 × 10⁻⁴ (n = 2 independent experiments).
(F) Top: schematic of the experimental setup. Constitutively active MEK1 (MEK1-CA: S218D/S222D) O.E. was driven by a doxycycline-inducible promoter. Center: correlation of Rb hyperphosphorylation in newborn cells and local density in mothers (n ≥ 16 cells per bin; control, n = 2,068 cells total; MEK1-CA O.E., n = 1,984 cells total). Data are representative of 4 independent experiments. Bottom: percentage of newborn cells with hyperphosphorylated Rb when gating for cells whose mothers experienced different local densities(n ≥ 10 cells per data point). The same gating was used for control and MEK1-CA O.E. Student’s t test; control conditions, p = 2.4 × 10⁻⁵; MEK1-CA O.E. conditions, p = 0.020; control versus MEK1-CA O.E., high density, p = 0.010 (n = 4 independent experiments).
(G) Top: schematic of the experimental setup. Bottom: mRNA and protein levels after drug treatment, measured by RNA FISH and immunofluorescence, respectively (MEK inhibitor: PD0325901, 100 nM). Error bars are 95% confidence intervals. Kolmogorov-Smirnov test; cyclin D1 mRNA, p = 7.9 × 10−99; p27 mRNA, p = 1.6 × 10⁻¹⁷; cyclin D1 protein, p = 1.5 × 10−59; p27 protein, p = 4.6 × 10−67 (n ≥ 320 cells per condition). Data are representative of 3 independent experiments.
See also Figure S5.
