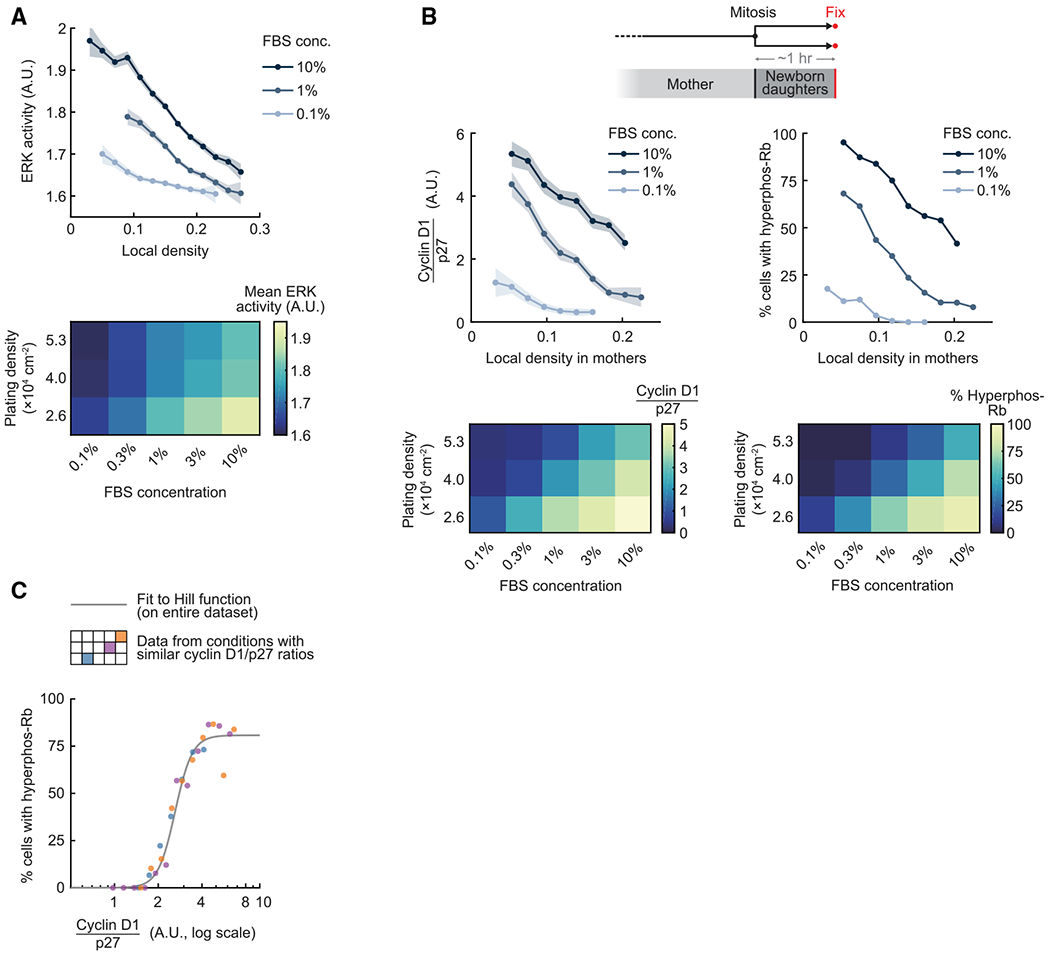
Figure 5. Competing cell density and mitogen signals shift the same activator-inhibitor balance to decide whether newborn cells exit to quiescence.

(A) ERK activity was time-averaged over 4 h. Top: line plots are population medians of 25 or more cells per bin; shaded error bars are 95% confidence intervals. Bottom: population medians of ERK activity (n ≥ 200 cells per condition). Data are representative of 3 independent experiments.
(B) Top: line plots are population medians of 30 or more cells per bin; shaded error bars are 95% confidence intervals. Bottom: population medians of cyclin D1/p27 ratio and percentage of cells with Rb hyperphosphorylation (n ≥ 250 cells per condition). Data are representative of 3 independent experiments.
(C) Percentage of newborn cells with Rb hyperphosphorylation is plotted as a function of cyclin D1/p27 ratio (n ≥ 20 cells per bin, n ≥ 320 total for each condition). The Hill curve was fitted to the entire dataset. The color-coded schematic in the legend corresponds to the heatmaps in (B).
See also Figure S6.
