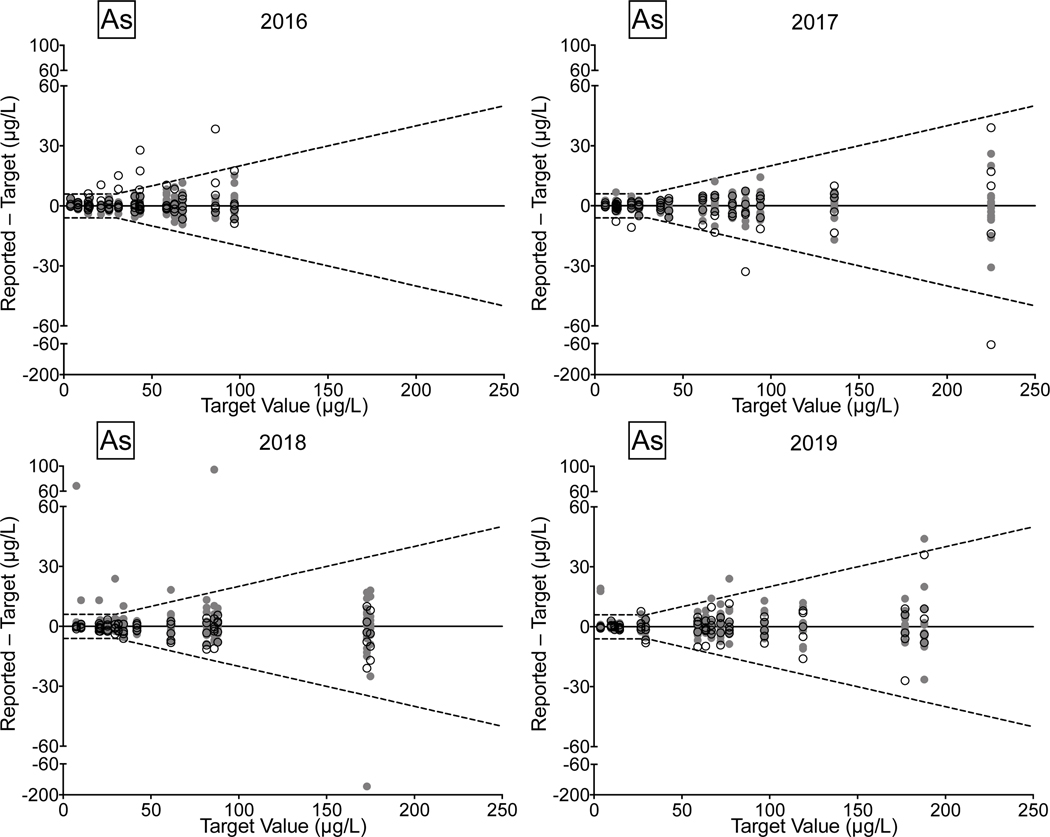
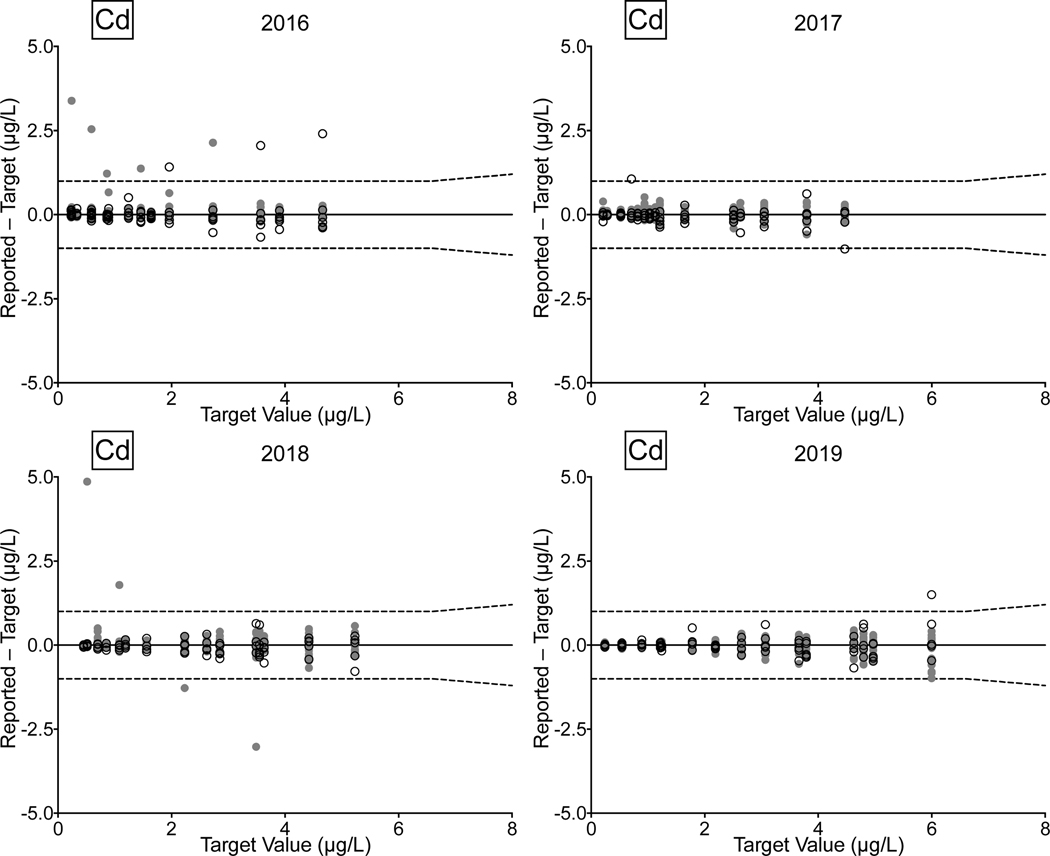
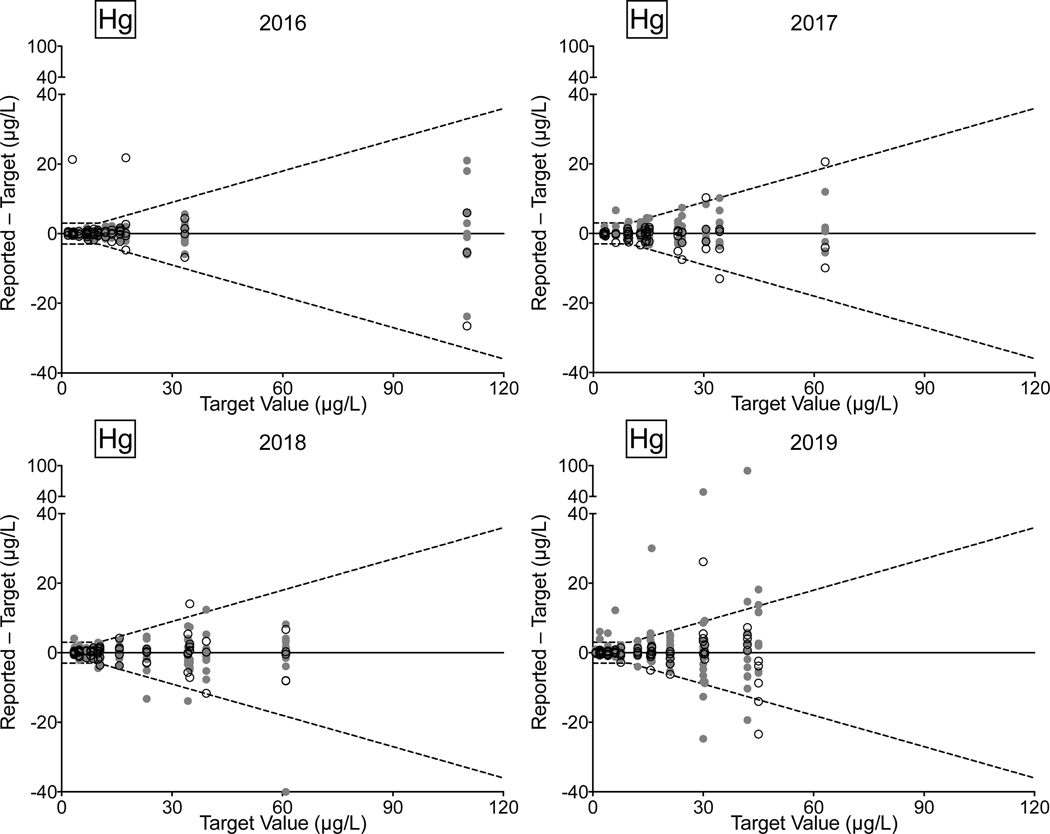
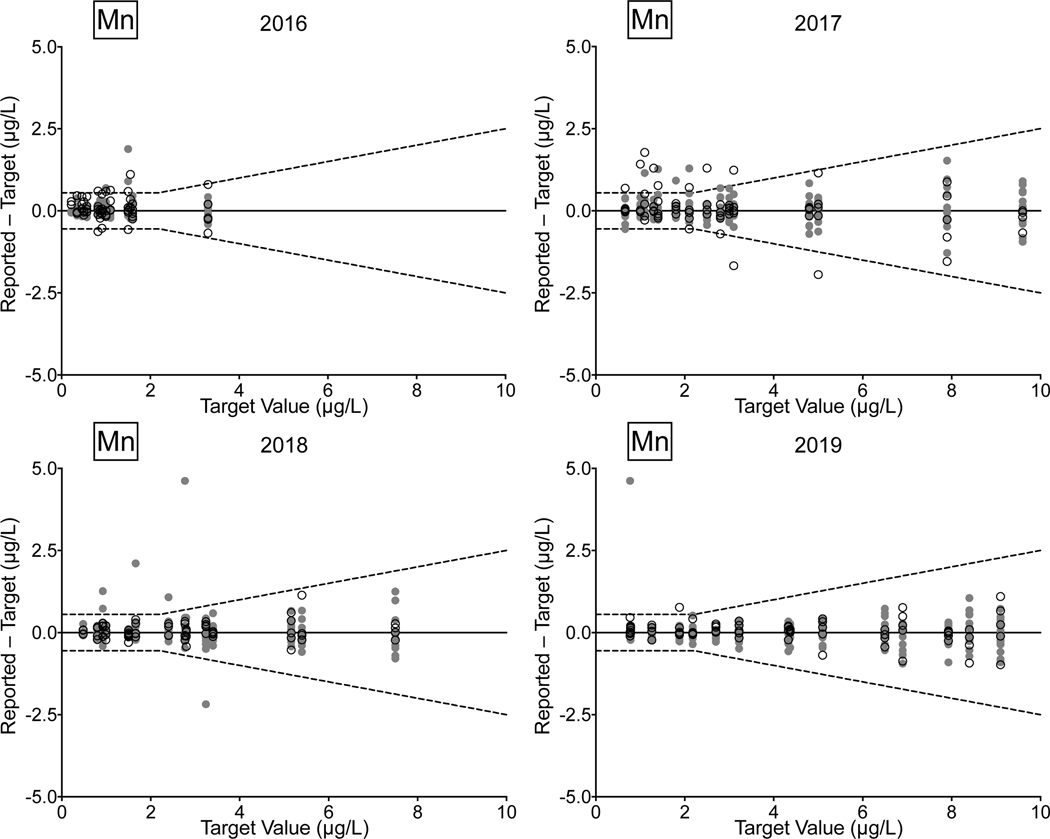
Figure 4.
Performance in the NYS Biomonitoring PT Program is shown for As (4a), Cd (4b), Hg (4c), and Mn (4d) in urine over four years of participation (2016–2019) as a function of target value. The solid line represents no difference between the lab-reported value and the assigned value, while the dashed lines show ± quality specifications for each analyte. CHEAR data are shown as open black circles; other participant data are shown as gray circles.


