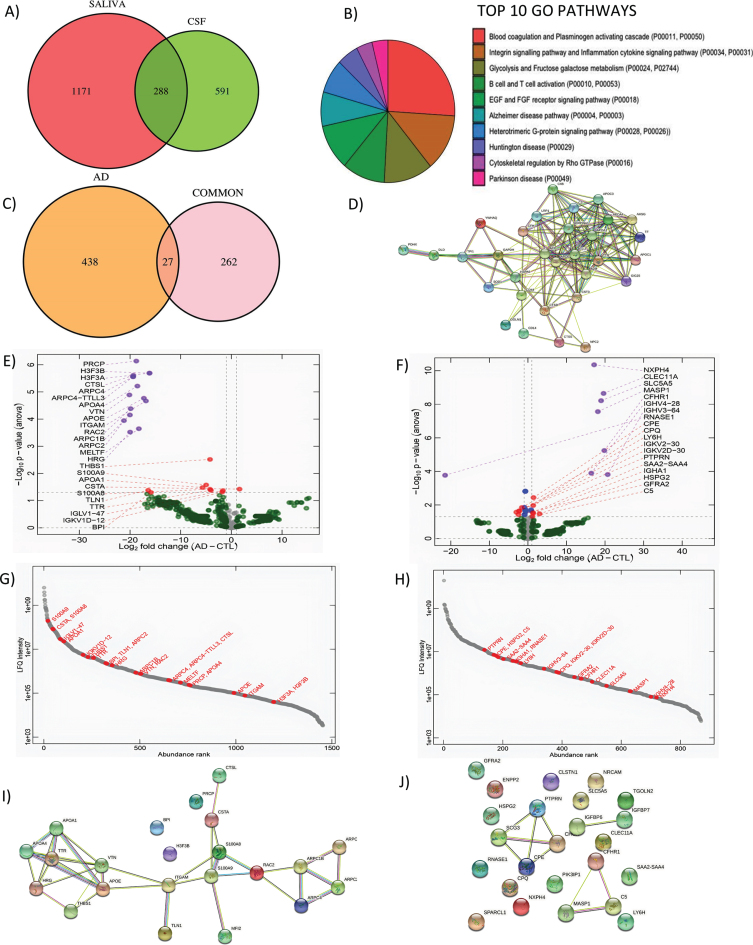
Fig. 1.
Shotgun proteomics to compare saliva and CSF and correlation analysis of differentially expressed genes in saliva. A) GO Biological pathways for salivary proteins. B) Number of shared proteins between saliva and CSF. C) Number of shared hits between common proteins and AD related proteins. D) STRING map shows the functional association based on the string database indicating the interactome of commonly shared proteins in saliva and CSF with AD. E) Volcano plots showing differential expression in saliva and F) CSF between AD and CN. G) Abundance rank dot plots for saliva and H) CSF shows the range of expression levels for the differentially expressed proteins. I) STRING map shows the interaction of differentially expressed proteins in saliva and J) in CSF. In the STRING map, the pink line represents the known interaction that is experimentally determined, blue line represents the known interaction from curated databases, green line represents predicted interaction due to gene neighborhood, red line represents prediction due to gene fusions and dark blue line represents prediction due to gene co-occurrence.

