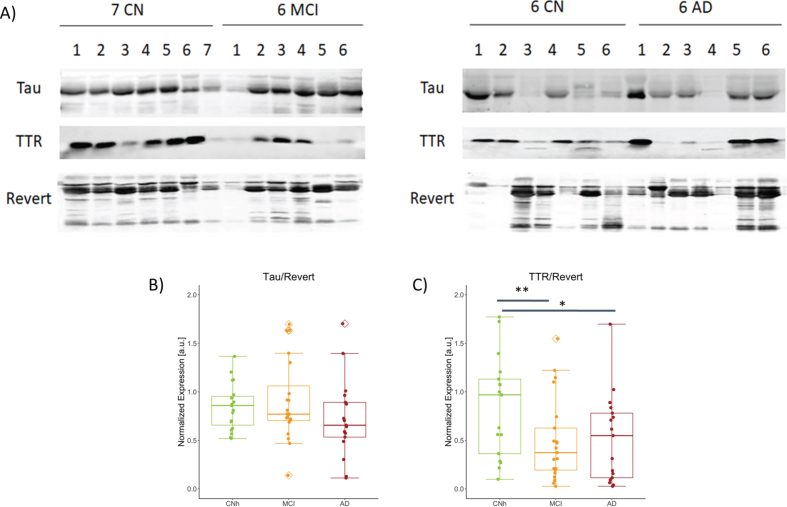
Fig. 2.
Abundance of TTR and S100A8 among the stages of AD. A) Representative images from western blot procedure to capture TTR and Tau bands, 17 kDa and 79 kDa respectively. No. of samples analyzed: CNh = 19, MCI = 21, AD = 17. Box plots with jitter across CNh, MCI, and AD groups show B) Tau expression normalized to loading control, Revert, CNh versus MCI t39 = 0.291, p = 0.437; CNh versus AD t35 = 0.278 p = 0.906; MCI versus AD t37 = 0.185 p = 0.241, C) normalized TTR, CNh versus MCI t39 = 0.007 p = 0.437; CNh versus AD t35 = 0.018 p = 0.019; MCI versus AD t37 = 0.845 p = 0.241. The whiskers on the boxplot represents the range of population and the horizontal line the median, *p < 0.05 and **p < 0.01.

