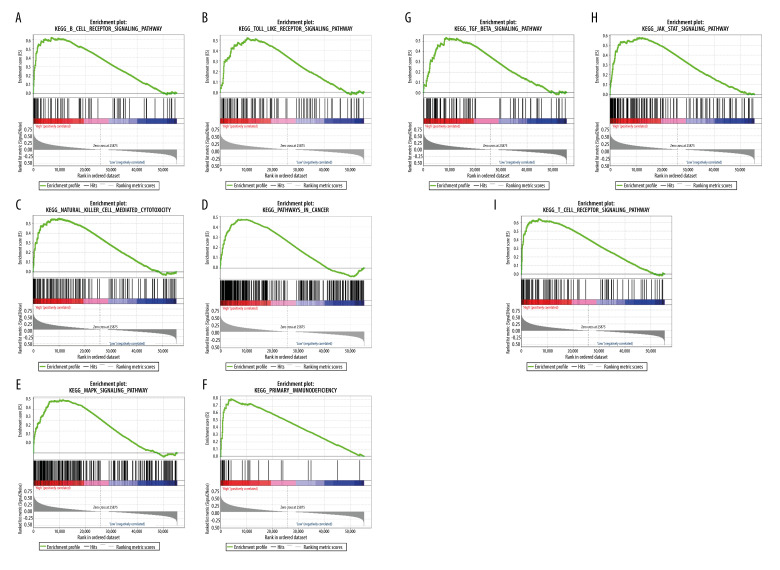
Figure 3.
(A–I) Gene Set Enrichment Analysis. Each line represents 1 particular gene set and high-expression genes are in the left, approaching the origin of the coordinates; by contrast, the low-regulated are on the right of the X-axis. Only gene sets with NOM P<0.05 and false discovery rate (FDR) q<0.05 were considered significant. Genes associated with a high-risk phenotype were significantly enriched with the immune-related pathway.

