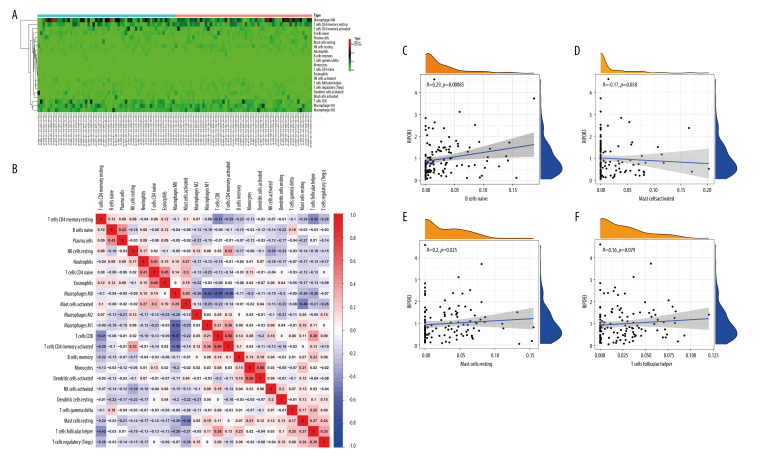
Figure 5.
Immune cell infiltration patterns and correlation of high and low RIPOR3 expression groups with differential immune cells. (A) Heatmap of tumor-infiltrating immune cells (TIICs) in low-expression (n=55) and high-expression groups (n=55). (B) Heatmap showing the correlation between 22 TIICs and numeric value in each tiny box indicating the P value of correlation between the 2 kinds of cells. The shade of each tiny color box represents corresponding correlation value between 2 cells, and Pearson coefficient was used for significance test. (C–F) Scatter plot showing the correlation of TIIC proportion with RIPOR3 expression. (* P<0.05, ** P<0.01, *** P<0.001).

