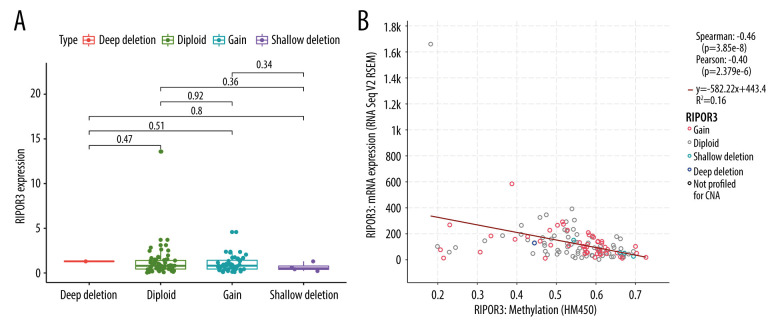
Figure 7.
Correlation of RIPOR3 expression levels with genetic and epigenetic mechanisms. (A) Copy number variation. (B) Methylation level. The red line in the plot was fitted with a linear model indicating the proportion of tropism of the methylation level along with RIPOR3 expression, and the Spearman coefficient was used for the correlation test. (* P<0.05, ** P<0.01, *** P<0.001).

