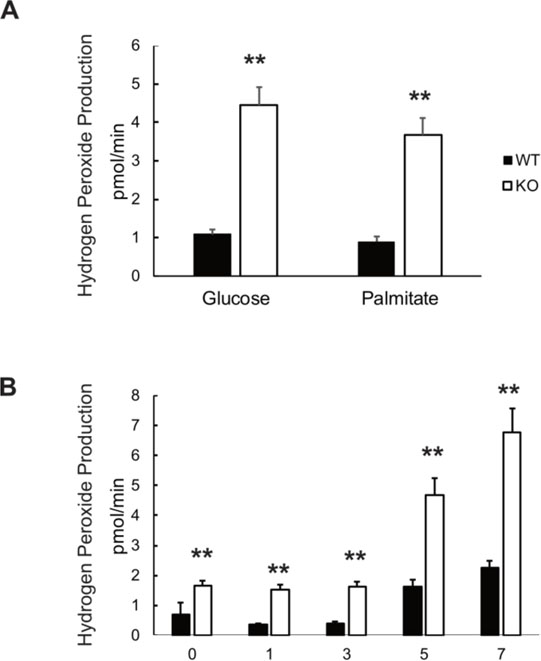
Figure 3.
Net rates of hydrogen peroxide production by wildtype and VWA8 null AML12 cells, measured using Amplex Red fluorescence. A. H2O2 net production in wildtype (closed bars) and VWA8 null cells (open bars) in response to glucose or palmitate as fuel (n=12, **P<0.01 vs. wildtype). B. Time course (days) of the rise in H2O2 production during differentiation of wildtype (closed bars) and VWA8 null cells (open bars) AML12 cells in the presence of palmitate. Data are given as Mean ± SD (n=12, **P<0.01 vs wildtype). Statistical analysis was performed using non-paired t-tests.

