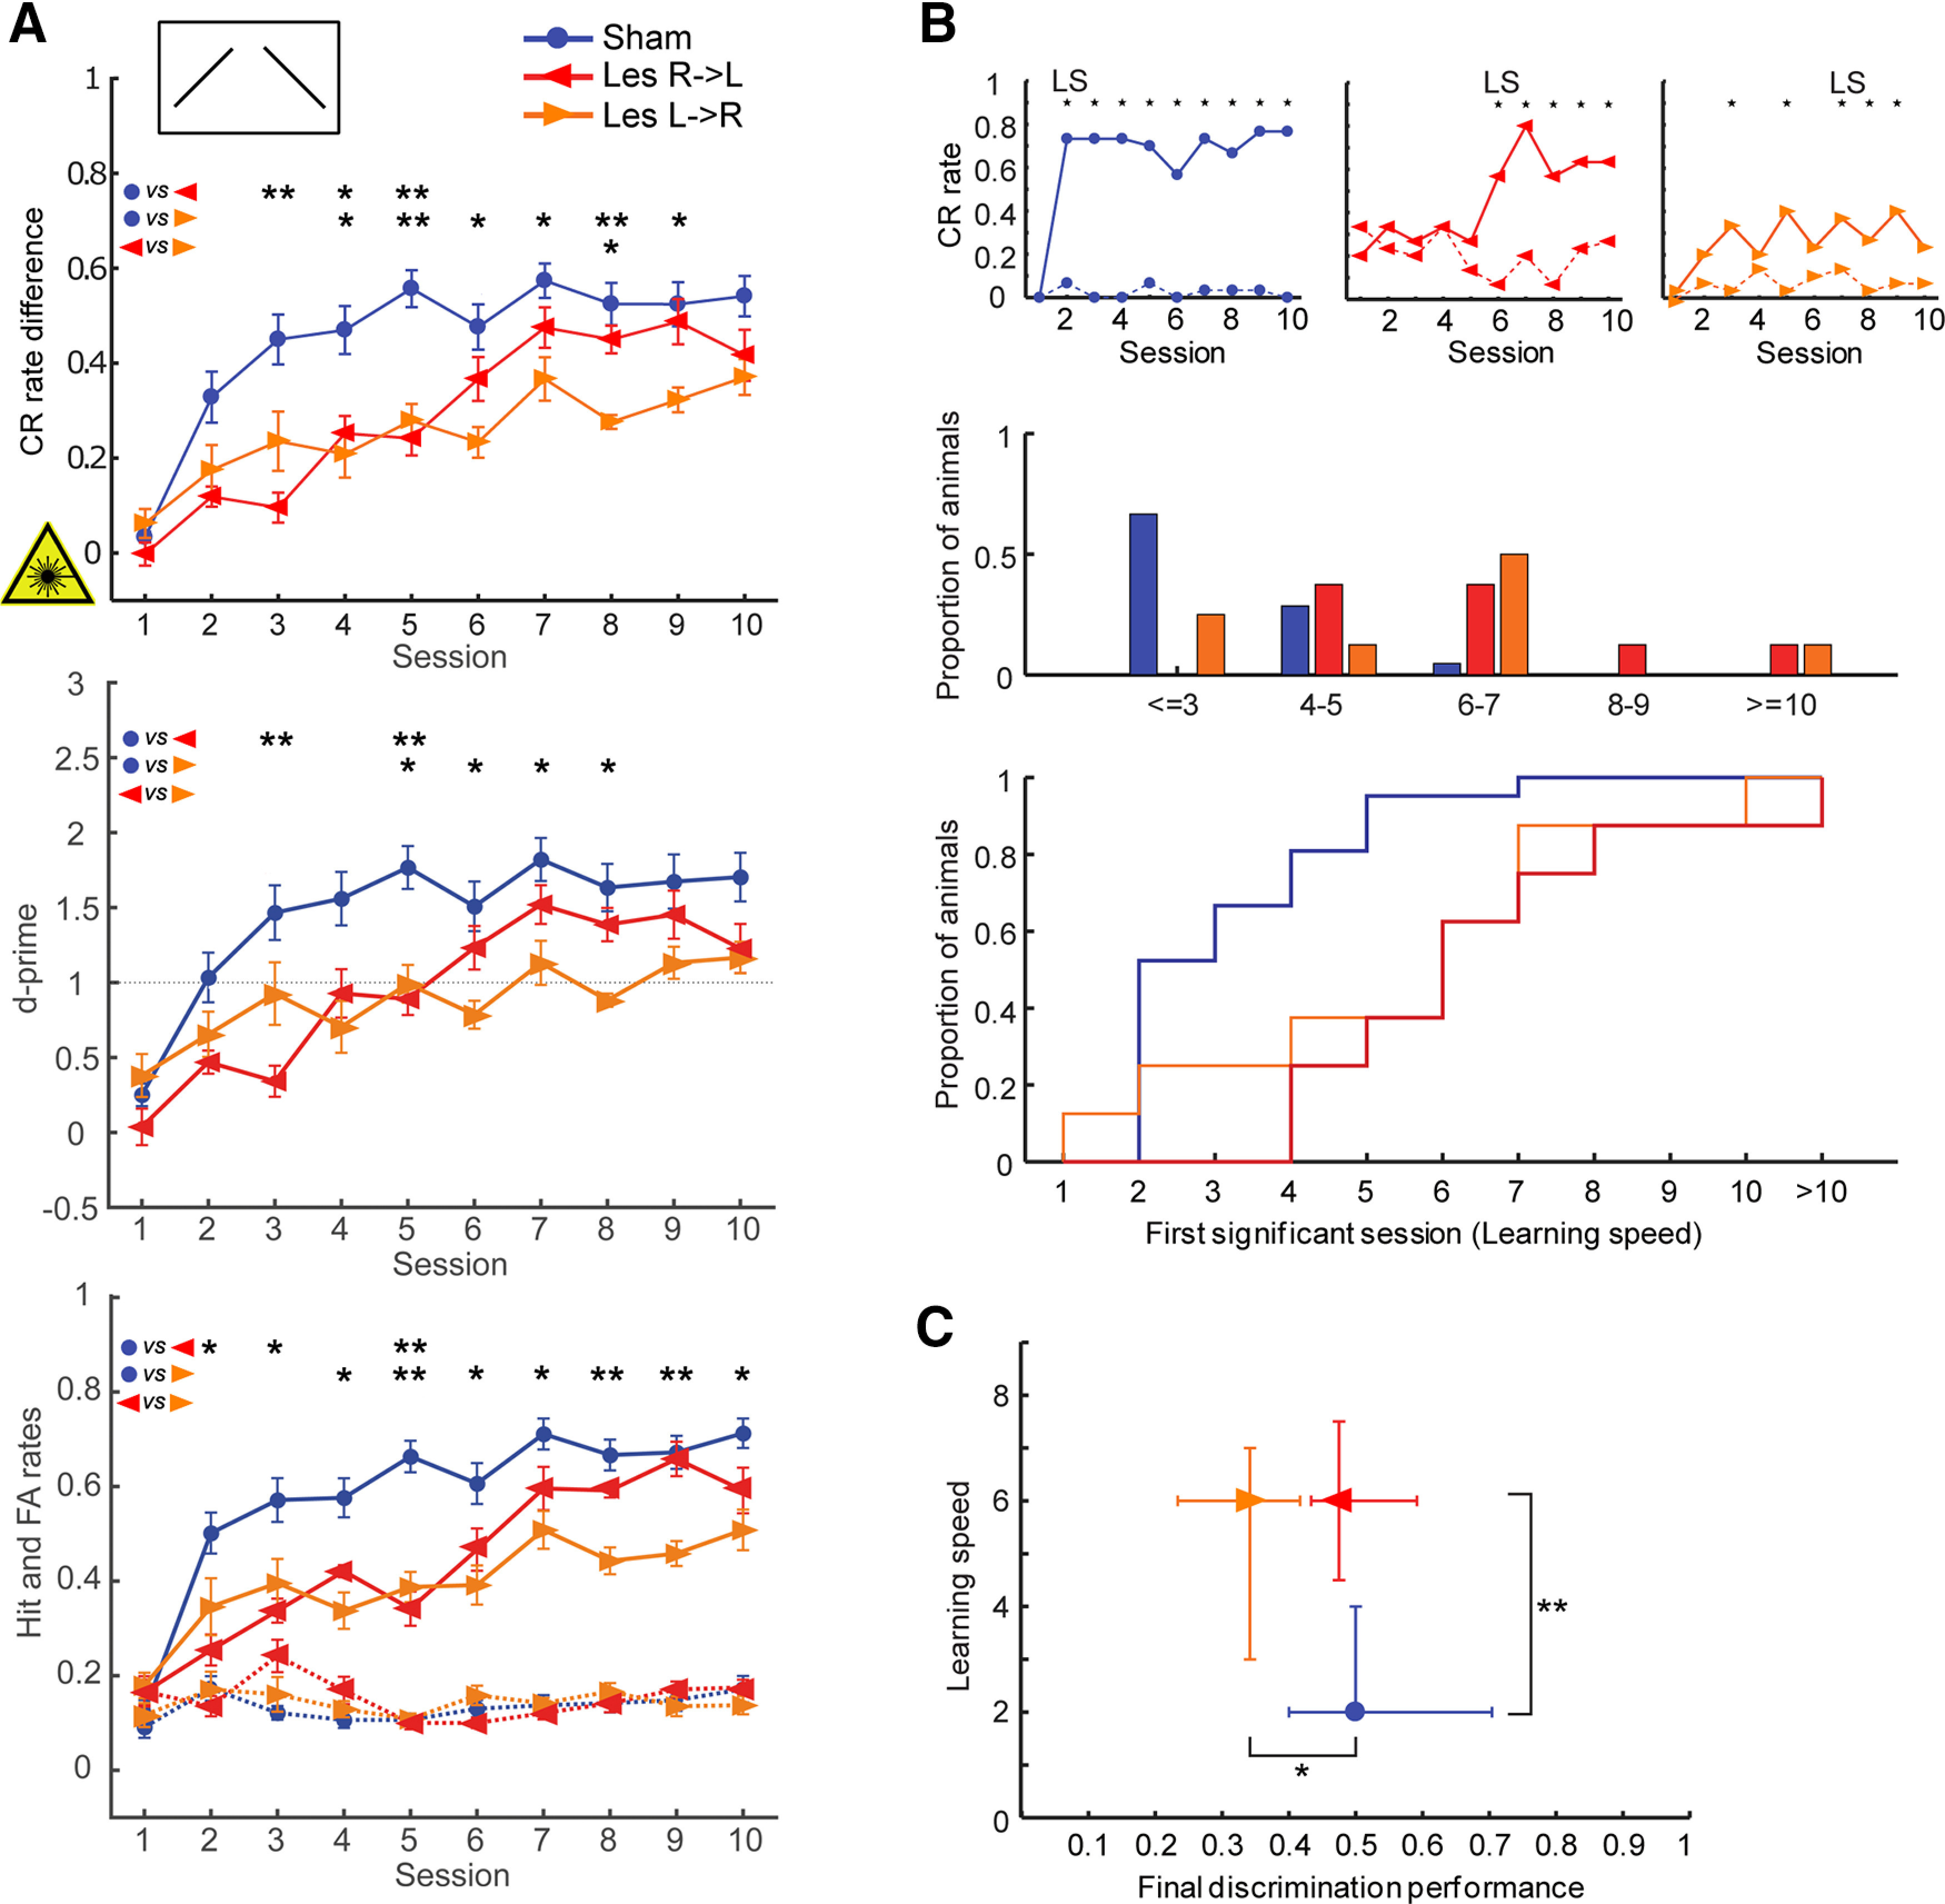
Figure 3.

Effects of interhemispheric lesions on the ability to discriminate between falling and rising continuous FM tones (250-ms duration, CS+: 1–2 kHz, CS–: 2–1 kHz), when the lesion was induced before training (acquisition paradigm, experiment 1). A, top, Learning curves show the mean (±1 SEM) of behavioral performance (CR rate difference: H rates minus FA rates) of lesioned and control animals in daily sessions. Lesioned animals took more sessions to acquire the direction discrimination task (see also B, C). Note that the Les L->R animals learned the task not as well as the other animals (see also C). Middle, Mean ± 1 SEM values of the parametric detectability index d-prime [(d' = z(H) – z(FA), where z(H) and z(FA) are the z transforms of H rate and FA, respectively]. Controls perform better than Les R->L animals during sessions 3 and 5, and better than Les L->R in sessions 5–8, comparable to CR differences measures. d-prime = 1 is indicated, which corresponds to a signal strength of 1 SD above noise. Bottom, Mean ± SEM of H (solid lines) and FA (dashed lines) rates. Performance differences between groups mainly based on differences in H rates. Nsham = 21; NLes R->L = 8; NLes L->R = 8. Between-group comparisons for each session were conducted using Holm–Bonferroni-corrected Mann–Whitney U statistics; *p < 0.05, **p < 0.01. B, top, Representative individual example learning curves showing Hs (solid line) and FAs (dotted line). Sessions with significant discrimination (*) as well as the learning speed (LS; first of at least two consecutive sessions with *) are indicated. Middle, Histograms showing the distribution of learning speed (LS) for each group. Sessions were binned into five time periods. Bottom, Step graphs depicting the cumulative learning speed. Between-group comparisons of learning speed distributions were conducted using Holm–Bonferroni-corrected Kolmogorov–Smirnov tests. Sham versus Les R->L: p = 0.0167, Sham versus Les L->R: p = 0.0485, Les R->L versus Les L->R: p = 0.9290. C, Scatter plot of learning speed versus final discrimination performance (DP; median of the CR rate differences across the last 4 training sessions). Given are median values and quartiles. Between-group comparisons were conducted using Holm–Bonferroni-corrected Mann–Whitney U statistics; *p < 0.05, **p < 0.01.
