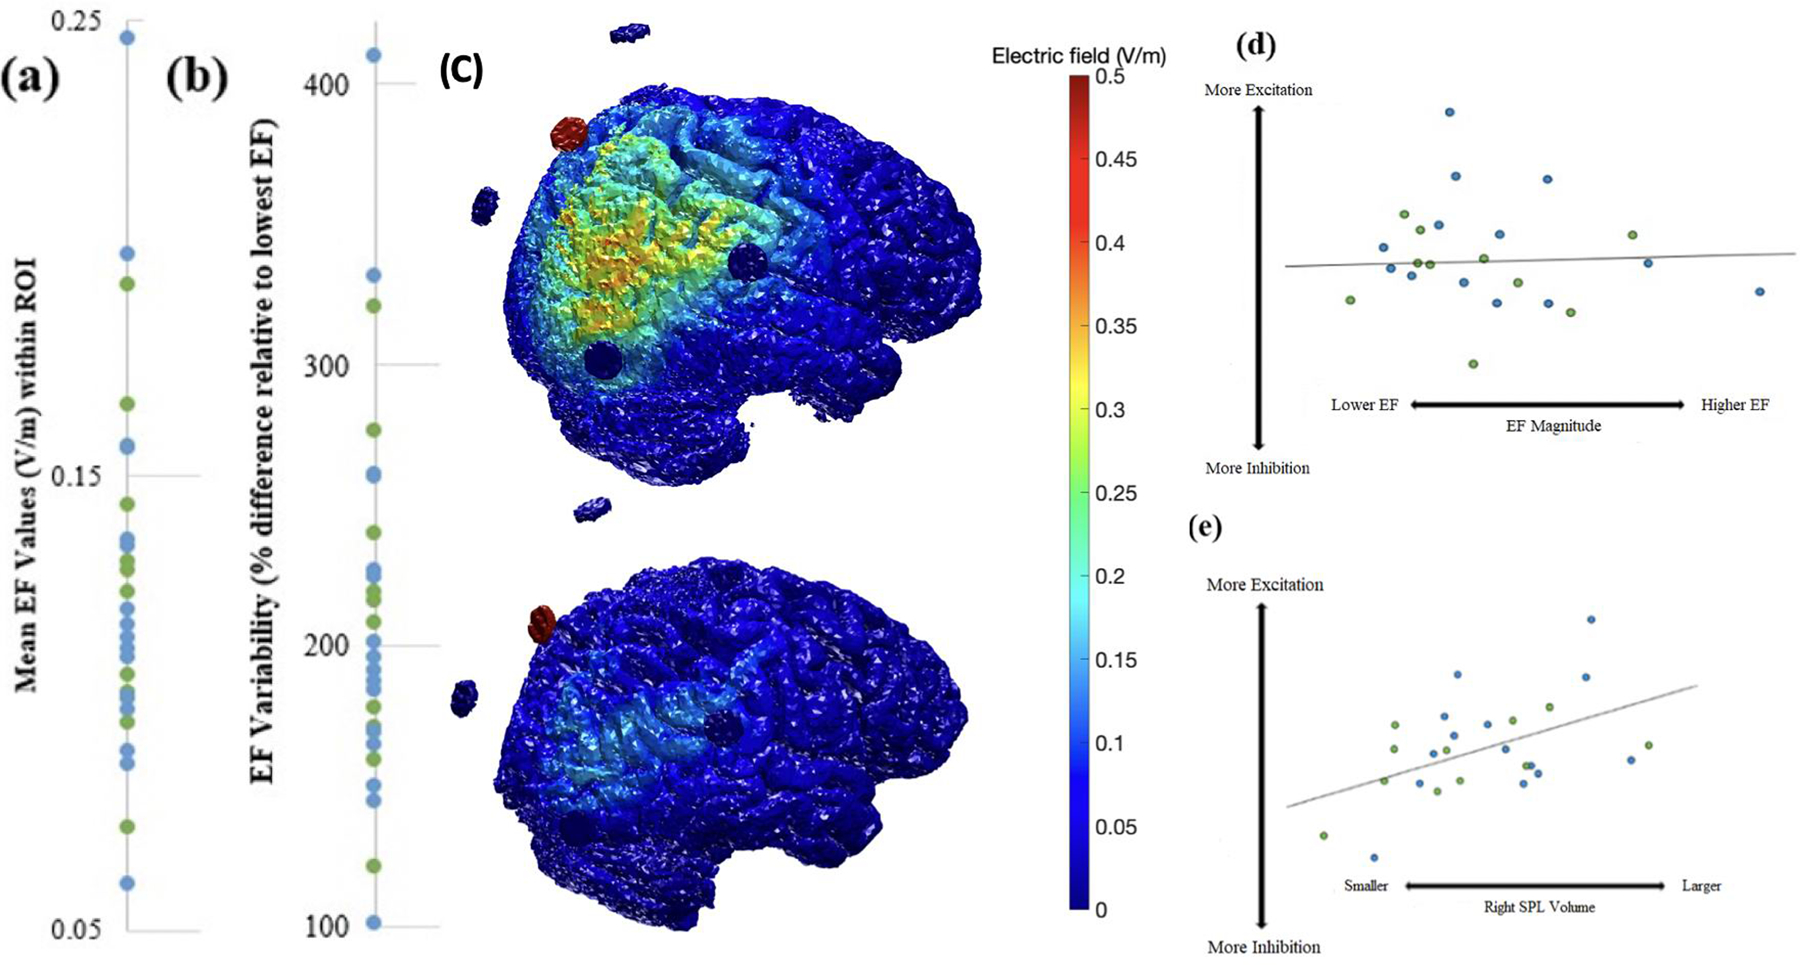
Figure 3.

(a) Mean EF values within the P2 1 cm3 ROI across participants. (b) Percent differences in EF relative to participant with lowest EF. (c) ROAST EF models of two participants illustrating striking variability in EF values. (d) Relationships between EF and degree of change in excitatory to inhibitory neurotransmitters (i.e., glutamate/GABA ratio) for the Healthy Control and MCI groups, covarying for MRS overlap and P2 Volume. (e) Relationship between P2 Volume and degree of change in excitation (i.e., glutamate to GABA ratio) for the Healthy Older Adult (HOA) and MCI groups.
