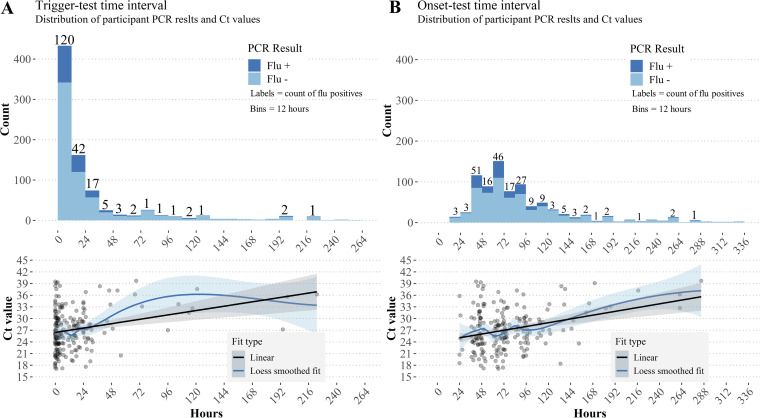
FIG 2.
Flu positivity and Ct trends for trigger-test and onset-test intervals. Ribbons indicate 95% confidence intervals for fitted lines. (A) Flu positivity rates decreased as the time between triggering the flu@home kit and using the RDT increased. Though samples were small for longer intervals, there was a linear relationship between Ct and trigger-test interval (P < 0.001). B) Time intervals between participant-reported onset of first symptoms and using the RDT were distributed more widely than trigger-test intervals, but positive tests are still concentrated within the first 72 h to 96 h. There was a linear relationship between onset-test intervals and Ct values (P < 0.001).

