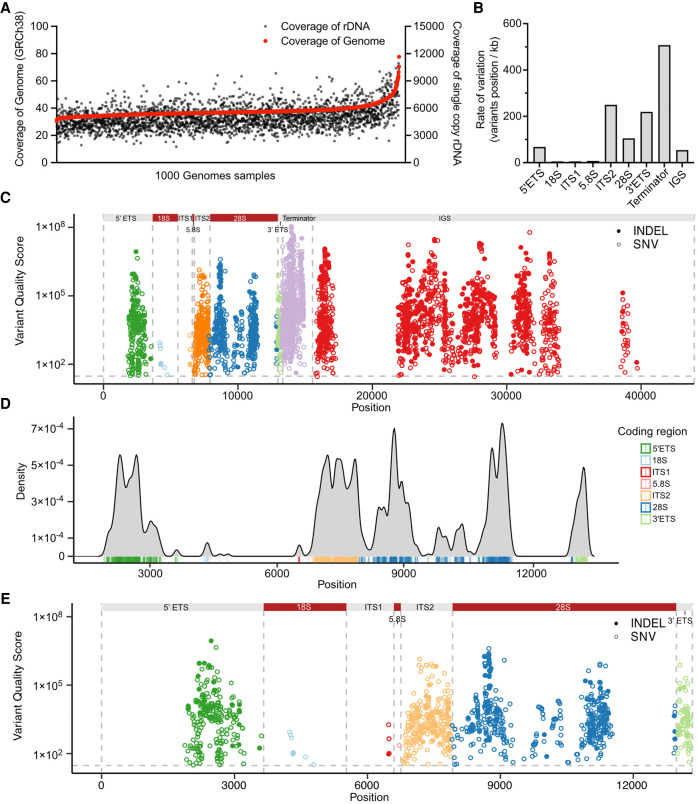
FIGURE 3.
rRNA gene variant discovery in the human genome. (A) Coverage of rDNA and whole genome reads are shown for each individual from the 1000 Genomes Project (n = 2504). (B) Number of variant positions in the rRNA gene domains per kilobase (kb). (C) Manhattan plot of variant distribution in a full-length 45 kb rDNA copy. Colors depict rRNA regions, which are indicated on the top. INDELs are shown in solid dots, and SNVs in circles. Gray horizontal line represents the variant quality score significance (QUAL) threshold set at 30. (D) Density plot of the variants in the 13 kb rDNA coding region. Coding region domains are color-labeled as indicated by the legend. (E) Manhattan plot of variant distribution in the rRNA coding region. Color-coding as in C.

