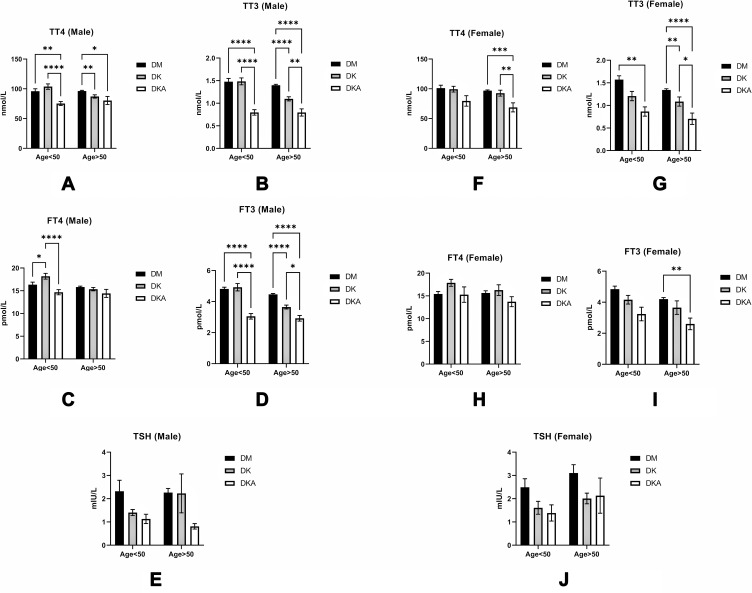
Figure 5.
Comparisons of thyroid function in DM alone, DK, and DKA; (A) in males, we observed a distinct declining tendency at both ages <50 and >50 in DM alone, DK, and DKA respectively; (B) in males, this tendency was overt in TT3 at both age>50 and age<50; (C) we could only observe a significant decrease in FT4 in DKA of males at age<50; (D) the decreasing tendency was significant at both ages; (E) We saw a declining trend at both ages of TSH, but it was not statistically significant; (F) In females, the declining of TT4 was overt at age>50; (G) We could find that the TT3 was lower significantly in DKA at both ages; (H) we could find the DKA groups at both ages had lower FT4 level, but there was no significance; (I) we could observe the declining trend at both ages, but it was clear in a group with age>50; (J) in males, the decreased TSH in DK and DKA did not reach the statistical significance.
Notes: *p<0.05, **p<0.01, ***p<0.001, ****p<0.0001.

