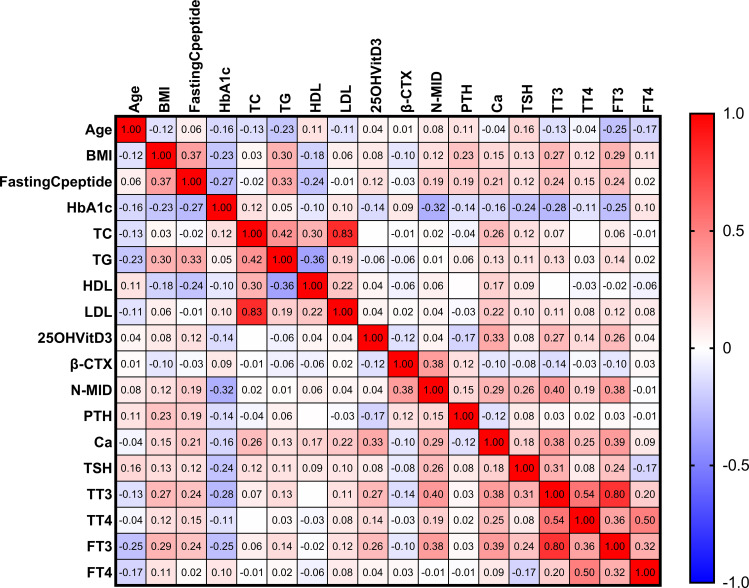
Figure 6.
The heatmap depicts the correlational relationships in analyzed variables of three groups. We found that β-CTX (r=0.38, p<0.05), TT3 (r=0.40, p<0.05), and FT3 (r=0.38, p<0.05) were positively (displayed in red color) correlated with N-MID, while HbA1c (r=−0.32, p<0.05) was negatively (shown in blue color) correlated with N-MID. The gradient in red represents the degree of positive correlation, while the gradient in blue represents the degree of negative correlation, as shown by the color bar on the right side of the map.

