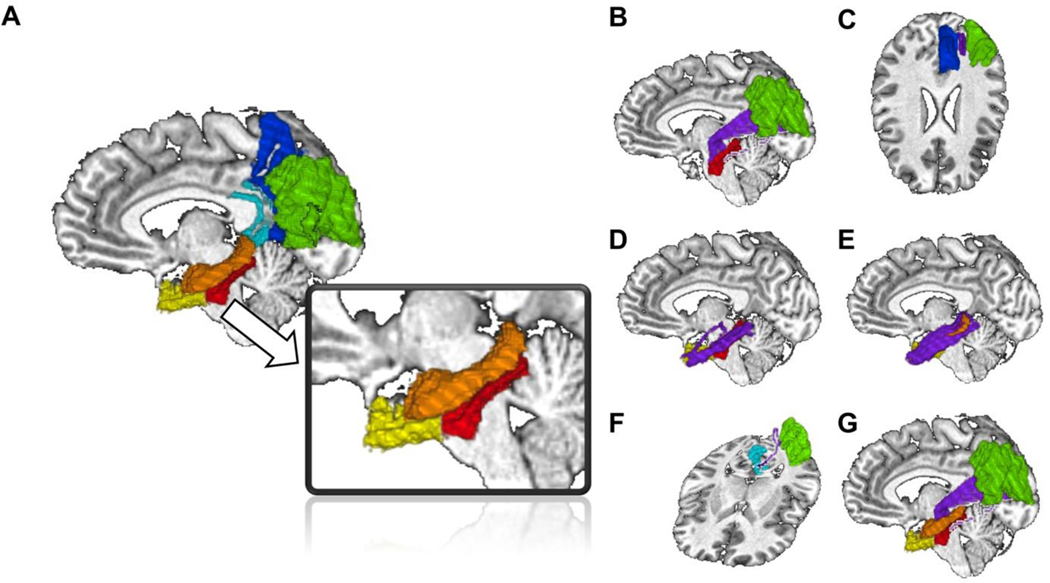
Figure 2.
ROIs and tracts for FA calculations. A. ROIs, including the precuneus (blue), IPC (green), retrosplenial cortex (cyan), parahippocampal cortex (red), entorhinal cortex (yellow), and hippocampus (orange) overlaid on a single participant’s brain. Tracts used to calculate FA are shown in purple and include the IPC-parahippocampus (B), IPC-precuneus (C), parahippocampus-entorhinal (D), entorhinal-hippocampus (E), IPC-retrosplenial (F), and IPC-hippocampal pathways (G).

