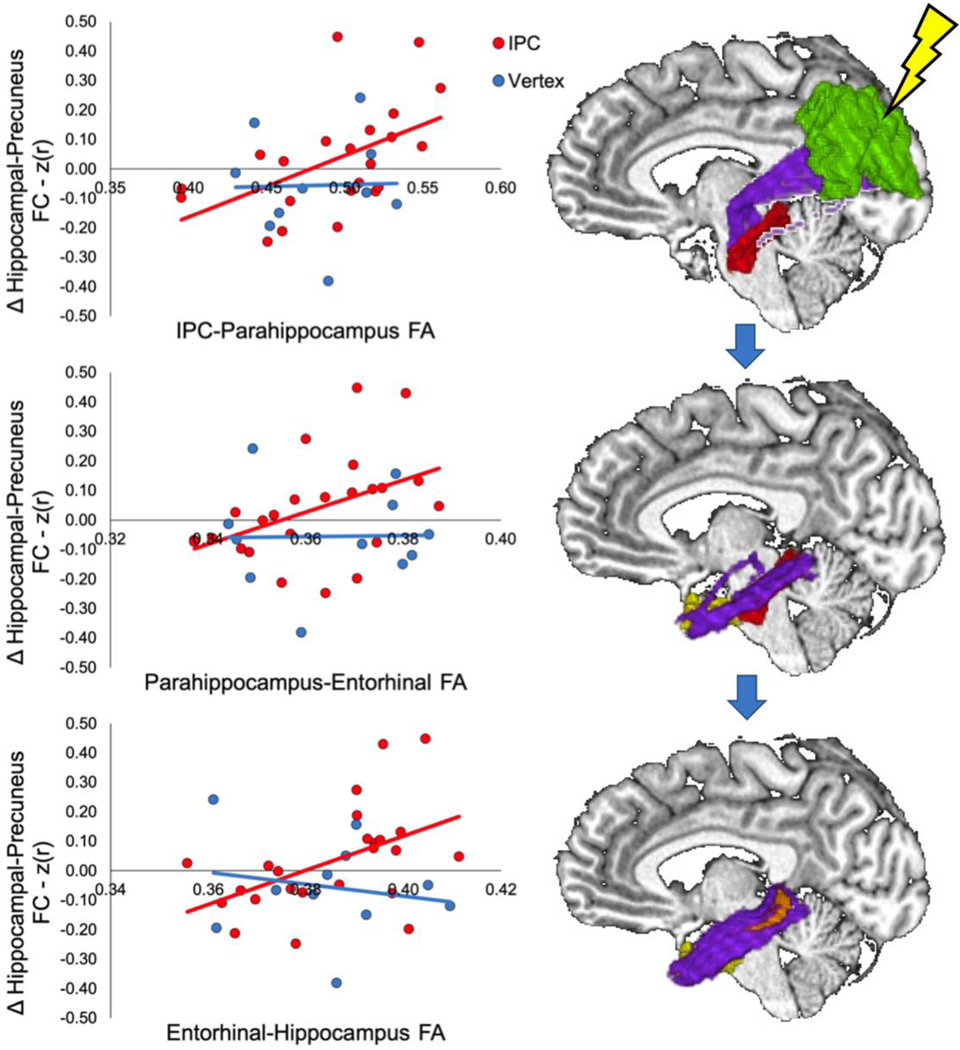
Figure 4.
Left: Scatter plots of FA-rsFC associations in tracts where the correlation values differed significantly by group. ROIs (right) include the IPC (green), parahippocampal cortex (red), entorhinal cortex (yellow), and hippocampus (orange) with corresponding tracts in purple. The lightning bolt represents stimulation location in the IPC. Arrows between images represent hypothetical path of signal from the IPC to the hippocampus.

