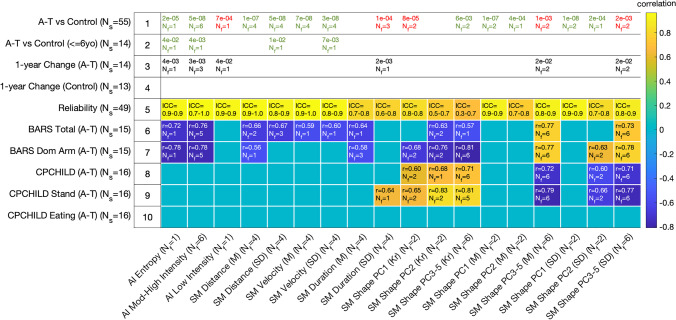
Fig. 3.
Relationship between each wrist sensor feature group and key clinical comparisons, including A-T versus control groups (rows 1–2), change over time in the A-T group (row 3) and the control group (row 4), reliability of features for both groups combined (row 5), relationships with the Brief Ataxia Rating Scale (BARS, rows 6–7), and relationships with Caregiver Priorities and Child Health Index of Life with Disabilities (CPCHILD, rows 8–10). Row 4 does not have any text since no features showed statistically significant change in the control group. Rows 1–4 report the number of features (Nf) that are significant within the feature group along with the most significant p value. Green text indicates when values are higher in the control group compared with the A-T group, and red text indicates when the value is higher in A-T compared with controls. Rows 5–10 report the number of significant features along with Intraclass Correlation Coefficients (ICC) or maximum absolute value of the Pearson correlation coefficient (r). The color of each cell also represents the value of the correlation coefficient. Abbreviations: Ns number of subjects, Nf number of features, AI activity intensity, SM submovement, PC principal component, M mean, SD standard deviation, Kr kurtosis, ICC intraclass correlation coefficient, BARS Brief Ataxia Rating Scale, CPCHILD Caregiver Priorities and Child Health Index of Life with Disabilities

