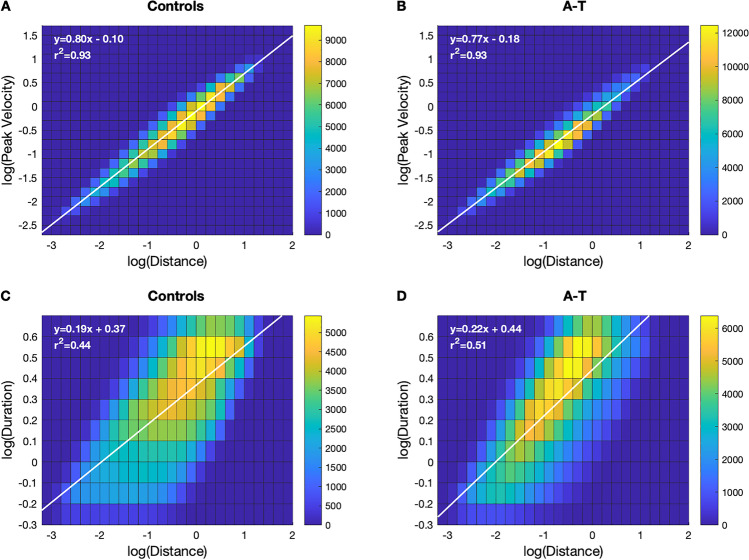
Fig. 5.
Two-dimensional, log–log histograms showing the relationships between submovement peak velocity and submovement distance (A–B) and submovement duration versus distance (C–D), separately for controls and individuals with A-T for long duration (0.6–5 s) submovements. The linear regression line and equation of each log–log relationship are shown in white. The slope of the line is equivalent to the scaling exponent of the power law relationship between the two variables

