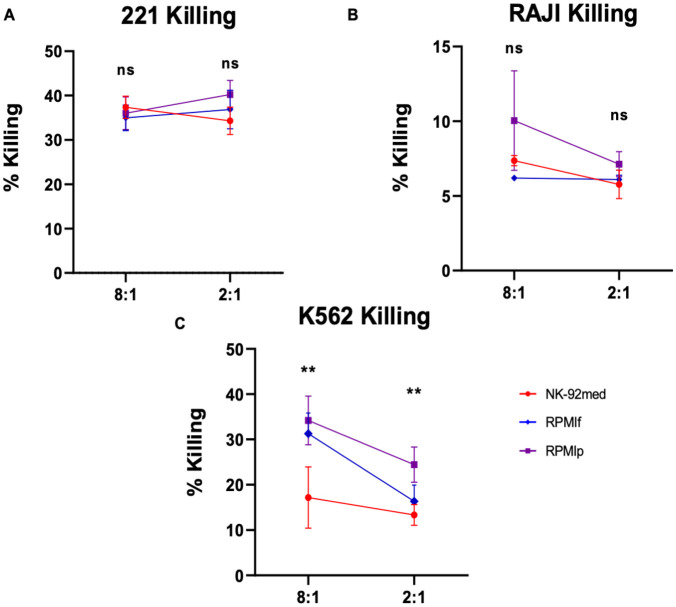
Fig 4. Comparison of killing potential.
Killing of A) 721.221 cells, B) Raji cells, and C) K562 cells. E:Ts: 8:1, 2:1 red = NK-92med., blue = RPMIf, violet = RPMIp. *p<0.05, **p<0.005 compared between the NK-92 in NK-92 medium as control and the NK-92 in RPMI + IL-2 medium (two-tailed ANOVA test). Shown is 1 representative out of 5 killing assays performed.

