. 2022 Jan 17;13(11):3094–3108. doi: 10.1039/d1sc05691c

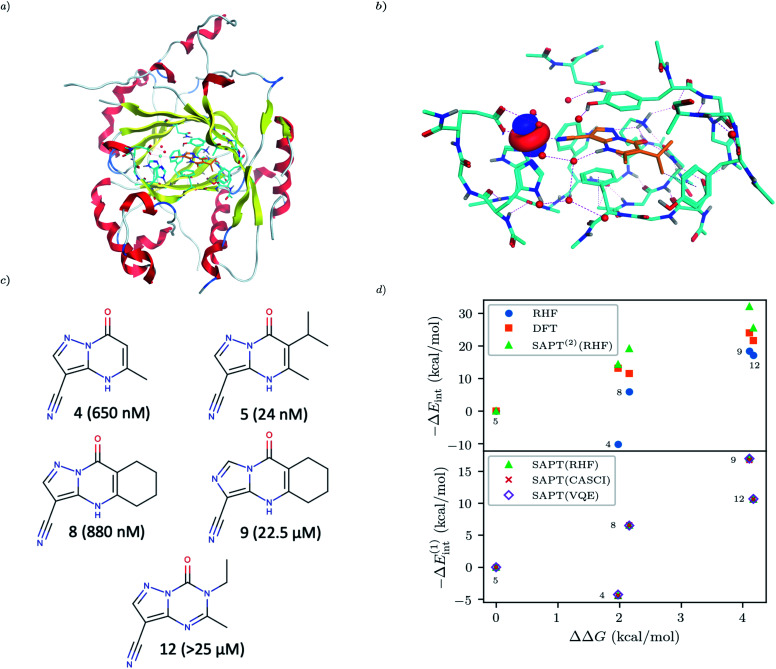
Fig. 5. (a) KDM5A protein structure50,51 (b) representative minimal active space molecular orbitals produced by the AVAS procedure, for the protein cutout described in the main text with ligand-5 colored as orange (c) 5 KDM5A inhibitors from ref. 52, (d) Upper Panel: Interaction energy differences computed using the super molecular approach (DFT(ωB97X-D) and RHF) and SAPT(2)(RHF) as a function of the difference in experimental free energies (see main text for definition). Lower Panel: First-order SAPT(VQE), SAPT(CASCI) and SAPT(RHF) first order interaction energy differences as a function of the differences in experimental free energies of binding. Note that ΔEint(x) = Eint(xref) − Eint(x) so − ΔEint will be positive if the ligand is predicted to have a smaller interaction energy (i.e. less negative) than the reference ligand (here taken to be ligand-5).

Fig. 5