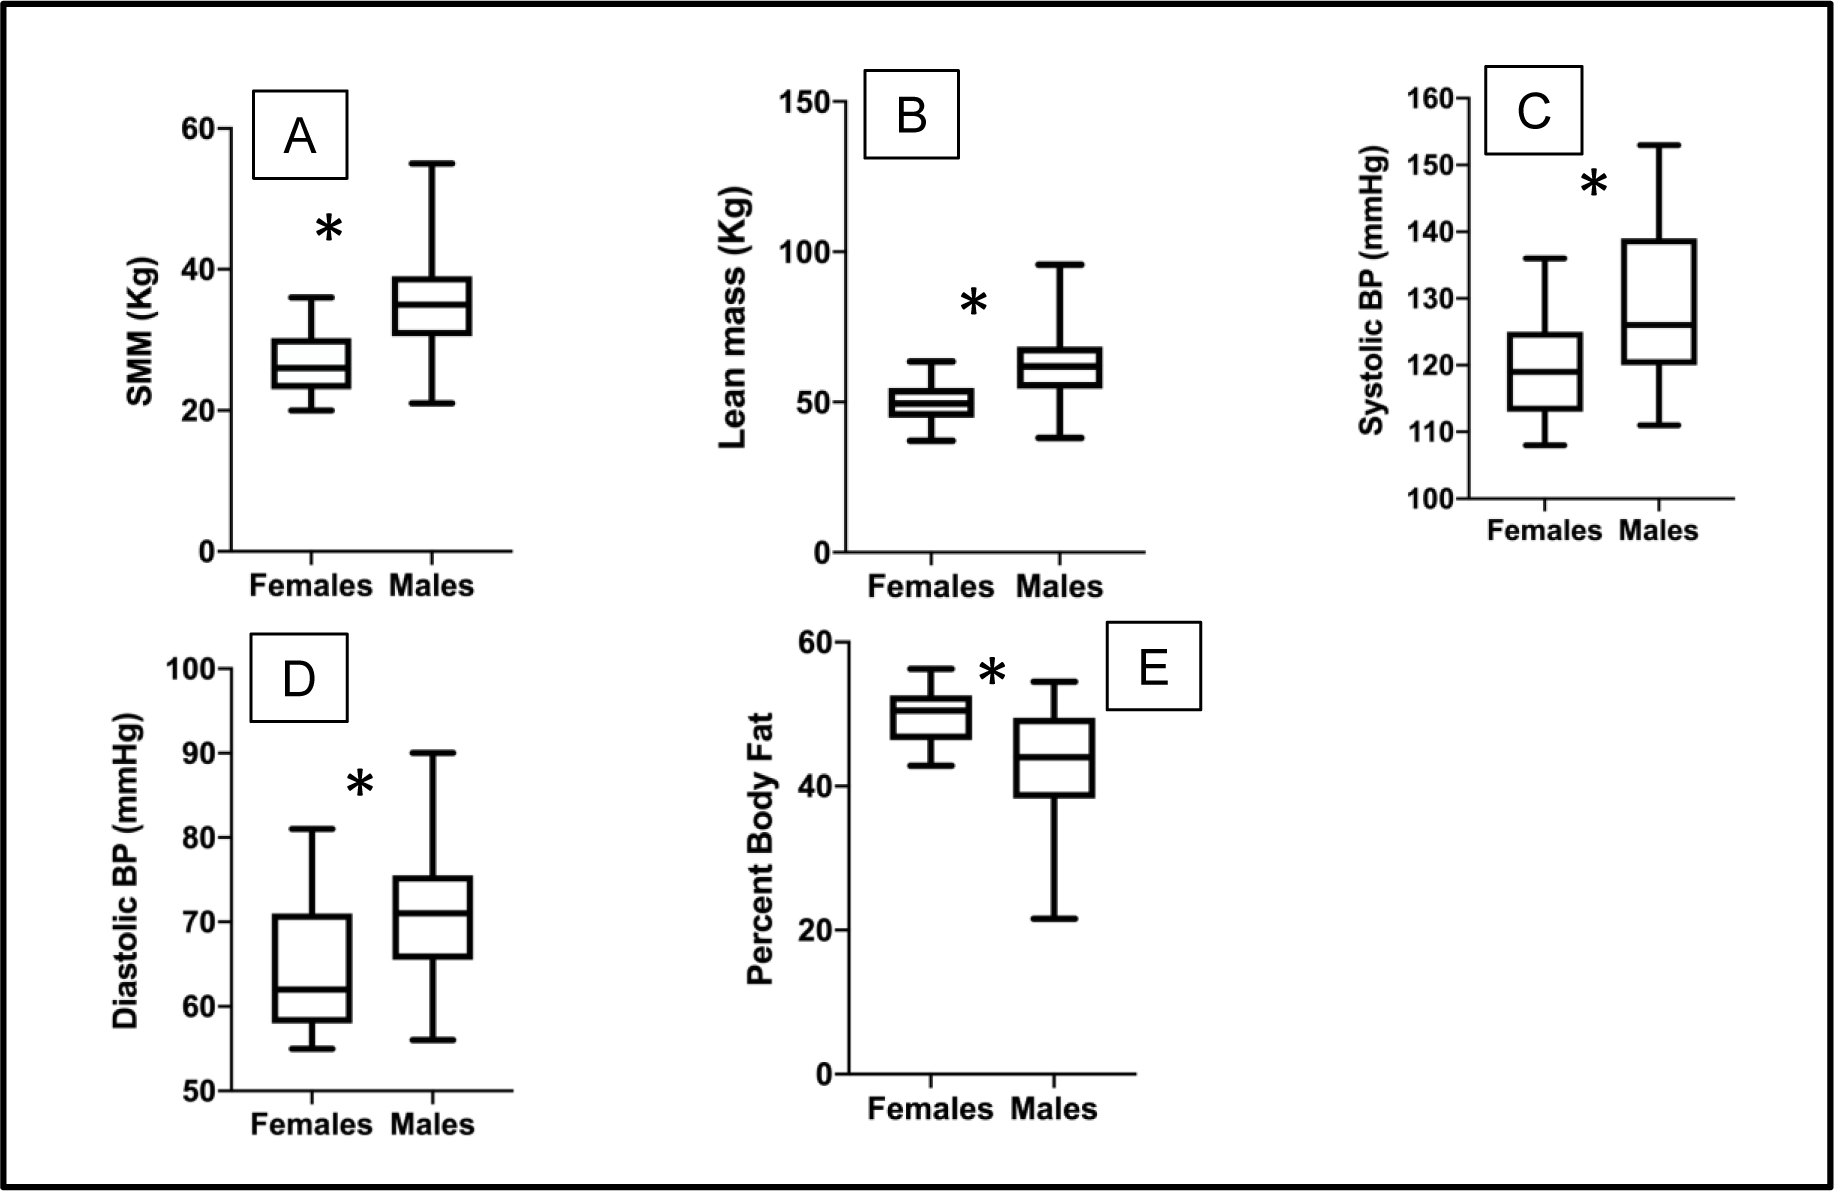
Figure 1:

Box plots showing the distribution and mean of A. SMM (skeletal muscle mass), B. lean body mass, C. systolic BP, D. diastolic BP, and E. percent body fat for female compared to male adolescents with obesity. The boxes represent interquartile range and whiskers represent minimum and maximum values. * represents p values < 0.05.
