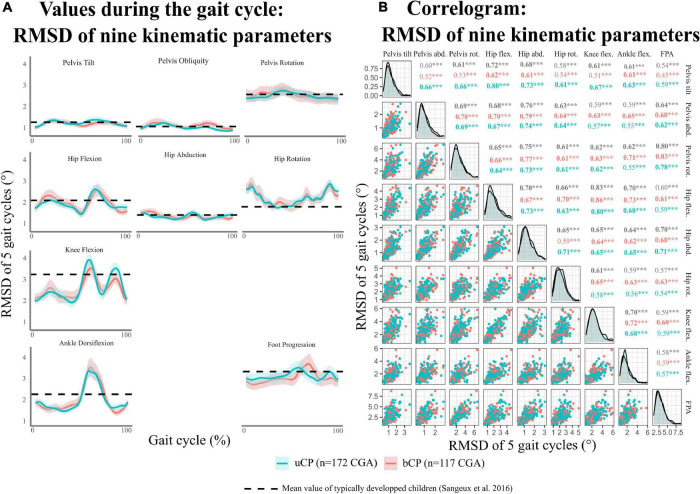
FIGURE 2.
(A) Distribution of kinematic intrinsic variability [evaluated using root mean square deviation (RMSD) for five gait cycles of the same visit] during gait cycle per kinematic parameters. (B) Correlogram of the mean RMSD for kinematic parameters. uCP, participants with unilateral cerebral palsy; bCP, participants with bilateral cerebral palsy; CGA, clinical gait analysis. Level of significance of Pearson correlations *p < 0.05; **p < 0.01; ***p < 0.001.

