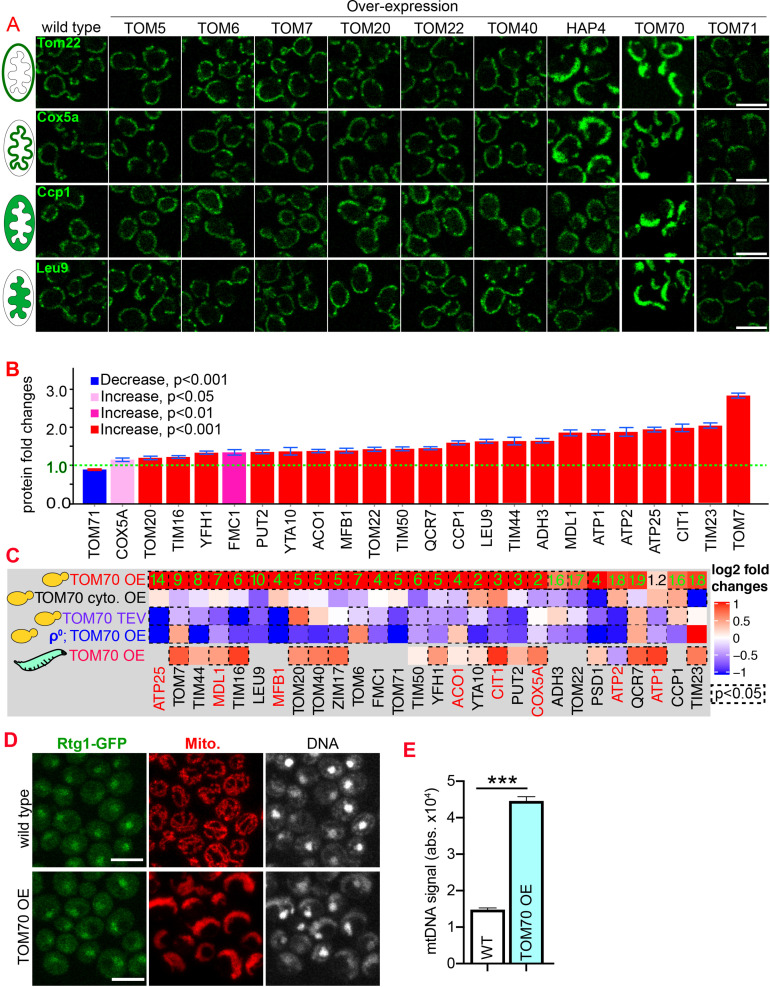
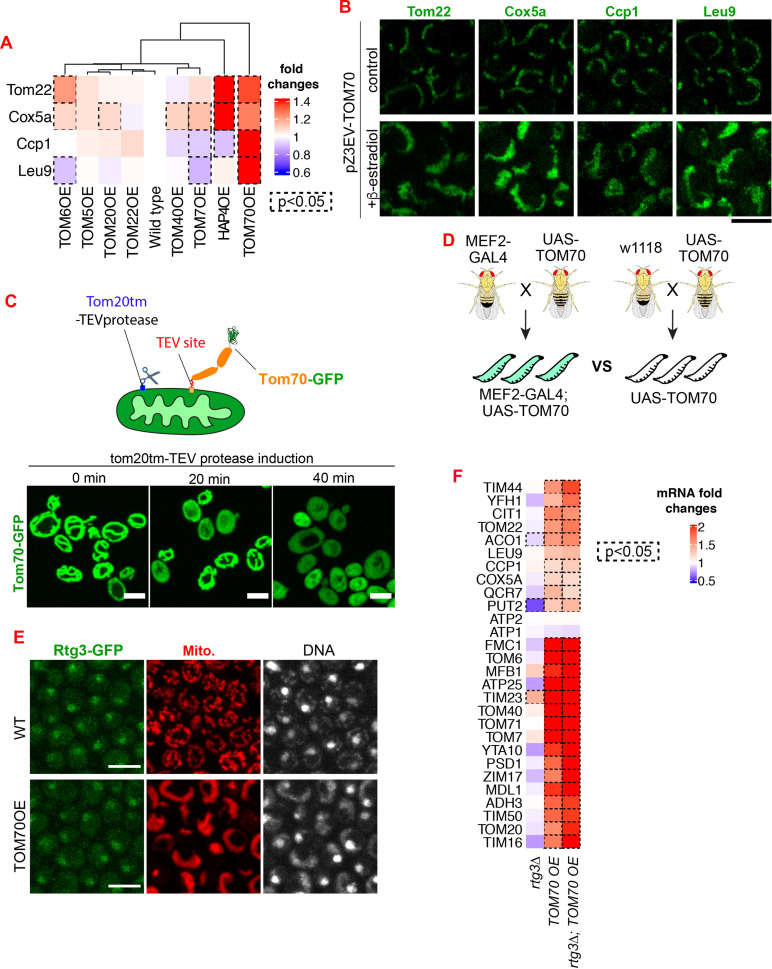
Figure 1. Tom70 regulates the transcriptional activity of mitochondrial proteins.
(A) Representative images for proteins localized to different sub-compartments of mitochondria in cells overexpressing (OE) different TOM proteins and HAP4 from pGal promoter. HAP4 OE increased the biogenesis of some, but not all, mitochondrial proteins. Mitochondrial proteins were visualized by endogenous C-terminal GFP tagging and expressed from their native promoters. As both wild type and OE strains were cultured in the same medium, the mitochondrial biogenesis effect of TOM70 OE and HAP4 OE is not due to the presence of galactose. (B) Quantification of mitochondrial protein levels in TOM70 OE cells normalized to wild-type cells cultured in the same medium. Mitochondrial proteins were visualized and quantified by endogenous C-terminal GFP tagging. These mitochondrial proteins were randomly chosen from the yeast GFP library based on their localization in mitochondria to represent all four sub-compartments of mitochondria. Bar graphs are the normalized mean and s.e.m. Data were analyzed with unpaired two-tailed t test. (C) RT-qPCR quantification of the mRNA abundance for different mitochondrial proteins in yeast and fruit fly strains with different levels of mitochondrial Tom70. TOM70 cyto. OE, overexpression of Tom70 cytosolic domain without transmembrane domain; TOM70 OE, TOM70 overexpression; TOM70 TEV, the cytosolic domain of Tom70 was removed by TEV protease.ρ0, petite cells without mtDNA. For yeast, cells with the same genetic background but lacking TOM70 TEV or TOM70 OE were used as control. For example, mRNA from ρ0/TOM70 OE cells were normalized to ρ0 cells lacking TOM70 OE. All different yeast strains, including the controls, were cultured in the same galactose medium. For fruit fly, 3rd instar larvae from control (UAS-TOM70) and TOM70 OE (Mef2-Gal4; UAS-TOM70) were used to extract mRNA from the whole animal. The mRNA abundance from each strain was normalized to control and the average fold changes from three replicates are shown. Only conserved orthologous genes from fly are included (https://www.alliancegenome.org/). Validated substrates of Tom70 are colored in red text (Backes et al., 2018; Kondo-Okamoto and Shaw, 2008; Melin et al., 2015; Yamamoto et al., 2009; Young, 2003). Dash line boxes indicate the ones with p < 0.05 from unpaired two-tailed t test. The inserted green numbers are fold changes of each protein in TOM70 OE cells. (D) Representative images of Rtg1-GFP in control and TOM70 OE cells. Rtg1-GFP, endogenous C-terminal GFP tagging of Rtg1. DNA was stained with Hoechst dye. All different yeast strains were cultured in the same galactose medium. (E) Quantification of mtDNA abundance from Hoechst staining in (D). 1116 and 1090 cells quantified for each. Data were analyzed with unpaired two-tailed t test: ***, p < 0.001. Scale bar for all images: 5 μm. Images are representative of at least two independent experiments. Sample sizes in B are given in Supplementary file 4.


