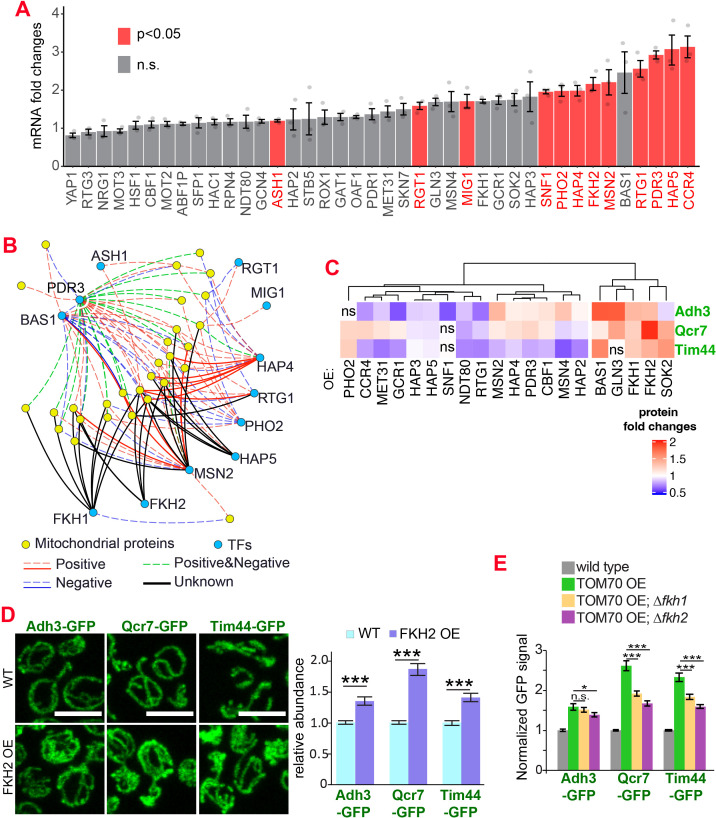
Figure 2. The transcription factors involved in the Tom70-dependent transcriptional regulation of mitochondrial proteins.
(A) mRNA abundance of different transcription factors (TF) quantified by RT-qPCR in TOM70 OE strain and normalized to control cells. All different yeast strains, including wild-type control, were cultured in the same medium. Shown are the mean and s.e.m. from three replicates. (B) TF regulatory network predicted for these mitochondrial proteins tested in Figure 1B (Monteiro et al., 2020). Only the TFs that increase significantly in (A) is included to simplify the illustration. The positive and negative regulations from existing literature are shown with red and blue lines, respectively; green lines represent the ones have both positive and negative effects. Solid lines represent the DNA binding evidence and the dash lines for co-expression evidence. The predicted regulations based on the consensus sequences but have no previous experimental data are shown as black lines. (C) Expression changes of mitochondrial proteins from different sub-compartments upon overexpression of different TFs. The GFP signal of Adh3-GFP, Qcr7-GFP, and Tim44-GFP were quantified from TF OE cells and normalized to wild type control of each protein. p < 0.05 for all of them except for four that labeled as ‘ns’. Data were analyzed with unpaired two-tailed t test. Both control and TOM70 OE strains were cultured in SC-raffinose medium and added 2% galactose for 5 hr before sample collection. (D) Representative images and quantification of different mitochondrial proteins in wild type and FKH2 OE strain. All different yeast strains were cultured in the same medium. (E) FKH1 and FKH2 are partially required for the mitochondria biogenesis program downstream of TOM70 OE. GFP signal of mitochondrial proteins were quantified in different strains and normalized to wild type. Scale bar for all images: 5 μm. Mitochondrial proteins were visualized by endogenous C-terminal GFP tagging and expressed from their own promoters. Images are representative of at least two independent experiments. Bar graphs are the normalized mean and s.e.m. Data were analyzed with unpaired two-tailed t test: ***, p < 0.001; *, p < 0.05; n.s., not significant. Sample sizes in (D, E) are given in Supplementary file 4.


