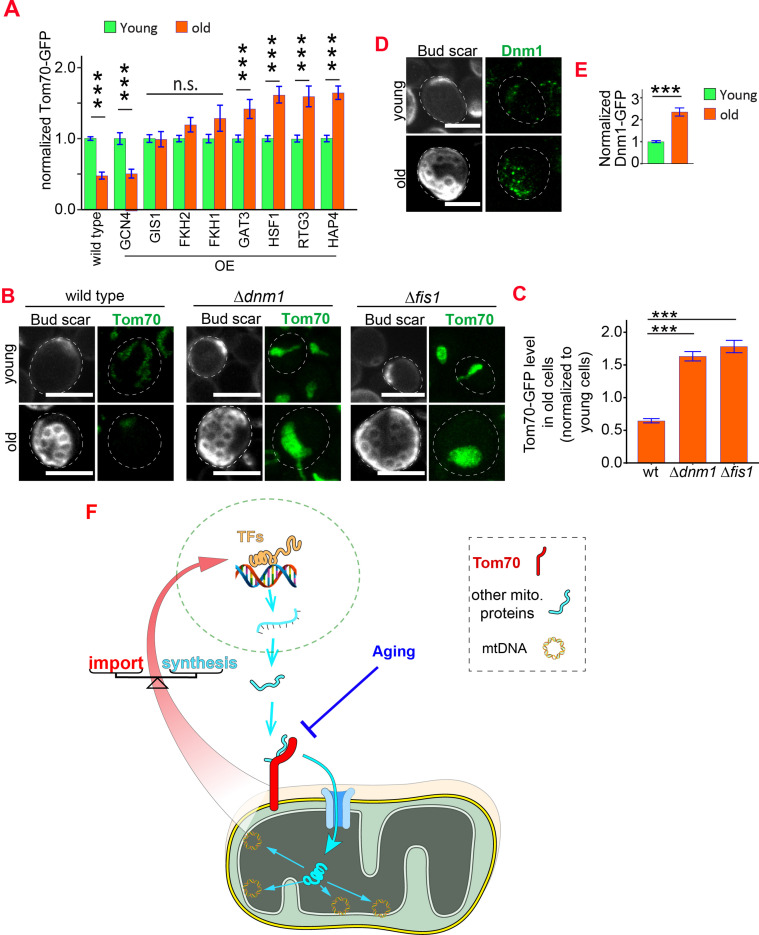
Figure 7. Reduced biogenesis and enhanced degradation underlying the age-dependent reduction of mitochondrial Tom70.
(A) Mean and s.e.m. of Tom70-GFP signal in young and old cells from strains overexpressing different TFs. Sample sizes are given in Supplementary file 4. Both young and old cells were from YEP-galactose medium. (B, C) Representative images (B) and quantification (C) of Tom70-GFP in young and old cells from wild type and mutant strains. Mean and s.e.m. from 57, 154, 50 old cells were normalized to young cells for each strain. Both young and old cells were from YPD medium. (D, E) Representative images (D) and quantification (E) of Dnm1-GFP in young and old cells. Mean and s.e.m. from 89 young and 53 old cells were quantified. Both young and old cells were from YPD medium. (F) Model of Tom70’s roles. Tom70 sits at the crossroad of cytosolic proteostasis and mitochondrial biogenesis by regulating both the biogenesis and import of mitochondrial proteins. The reduction of Tom70 during aging is associated with age-dependent mitochondrial defects. Scale bar for all images: 5 μm. Mitochondrial proteins were visualized by endogenous C-terminal GFP tagging and expressed from their own promoters. Images are representative of at least two independent experiments. Data were analyzed with unpaired two-tailed t test: ***, p < 0.001; **, p < 0.01; *, p < 0.05; n.s., not significant.


