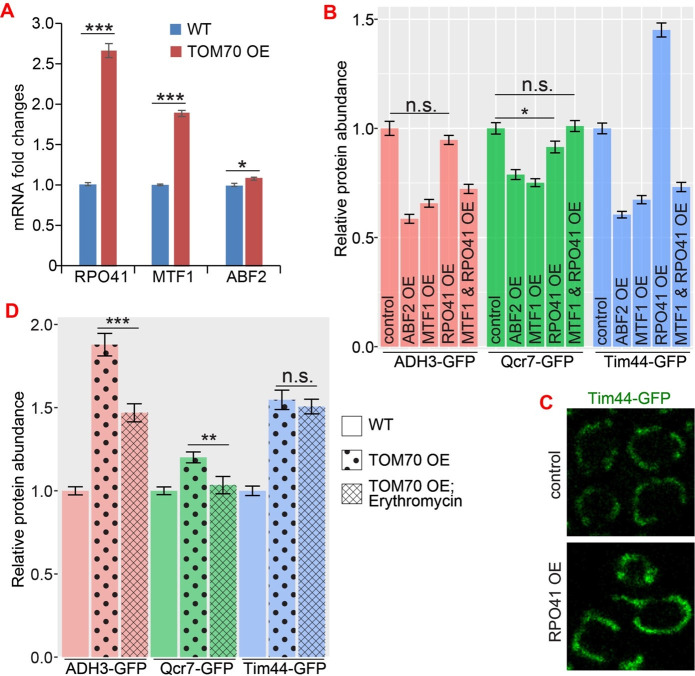
Author response image 1. The role of mtDNA metabolisms in Tom70’s regulatory function of mitochondrial biogenesis.
(A) mRNA abundance of basic mitochondrial transcription machineries quantified by qPCR in TOM70 OE strain and normalized to control cells. All different yeast strains, including wild type control, were cultured in the same medium. Shown are the mean and s.e.m. from three replicates. (B, C) Quantification (B) of different mitochondrial proteins in wild type control strain and other strains overexpressing different mitochondrial transcription machineries. All different yeast strains were cultured in the same medium. Only RPO41 OE increased Tim44-GFP expression among these strains. In fact, most of these overexpressing strains reduced the mitochondrial abundance, and the mitochondrial morphology in RPO41 OE cells (C) is different from TOM70 OE (Figure 1A), suggesting that these mitochondrial transcription machineries are not downstream of TOM70 OE. (D) Quantification of different mitochondrial proteins in wild type control strain and TOM70 OE strains with/without Erythromycin (2mg/ml) treatment. All different yeast strains were cultured in the same growth medium. Inhibition of mitochondrial translation by Erythromycin partially inhibit the mitochondrial biogenesis induced by TOM70 OE. Data were analyzed with unpaired two-tailed t test: ***, p<0.001; *, p<0.05; n.s., not significant.

