. 2022 Feb 28;11:e74338. doi: 10.7554/eLife.74338

Figure 1. RNA-Seq reveals differential gene expression in Hct116 Fbw7−/− and Fbw7R/+ cells.

(A) Genetically engineered isogenic cell lines used in the study: Hct116 wild-type (WT), Fbw7−/−, and Fbw7R/+. (B) Differentially expressed (DE) protein-coding genes (represented by each dot) in Fbw7−/− or Fbw7R/+ (FDR<0.05). Dashed lines mark log2FC=0.6. (C) Hierarchical clustering of DE protein-coding genes. The heatmap shows the intensity of expression of each gene (y-axis) for three replicates per cell type (x-axis). Three replicates per cell type were included. Replicates for each genotype were from a single clone, however from separately cultured samples. (D) Transcription factors, pathways (MSigDB), and GO terms that were enriched in genes upregulated in Fbw7−/− and Fbw7R/+ Hct116 cells. Detailed output of differential expression analysis, hierarchical clustering, and Enrichr analysis are provided as Figure 1—source data 1, Figure 1—source data 2, Figure 1—source data 3, respectively. See Figure 1—figure supplement 1 for the PCA of Hct116 RNA-Seq and Figure 1—figure supplement 2 for cell proliferation data. GO, gene ontology; PCA, principal component analysis.

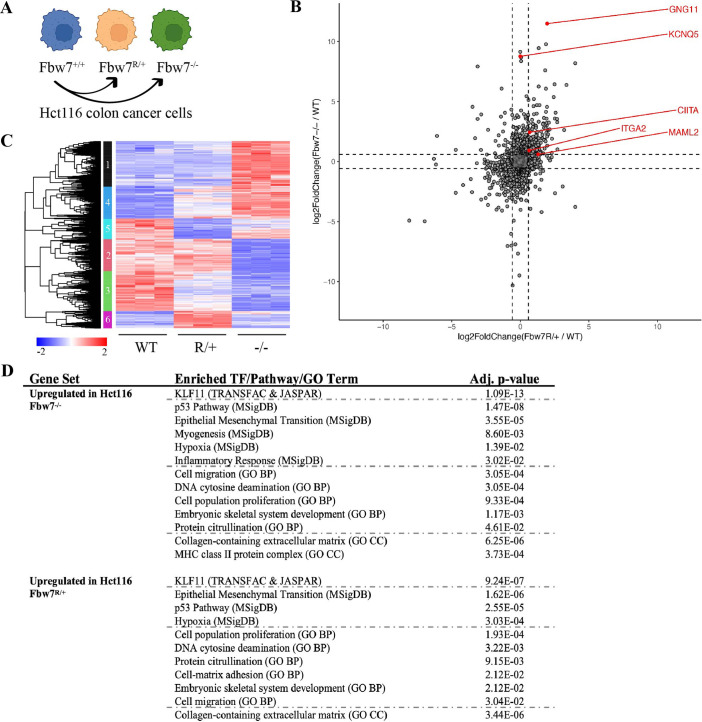
Figure 1—source data 1. Differential expression analysis of Hct116 RNA-Seq.
This Excel file contains the differential analysis output of Hct116 RNA-Seq data from WT, Fbw7−/− (Del), and Fbw7R/+ (R). DE=0, not differentially expressed (DE) in the mutant compared to WT; DE=1, DE in the mutant compared to WT. WT, wild-type.
Figure 1—source data 2. Hierarchical cluster output file.
This Excel file includes genes that belong to each cluster in the hierarchical cluster analysis.
Figure 1—source data 3. Enrichr output for Hct116 differentially expressed genes.
This Excel file includes the TRANSFAC & JASPAR, MSigDB, and GO term outputs enriched in differential (upregulated or downregulated) genes in Fbw7/ and Fbw7R/+ Hct116 cells. GO, gene ontology.

Figure 1.

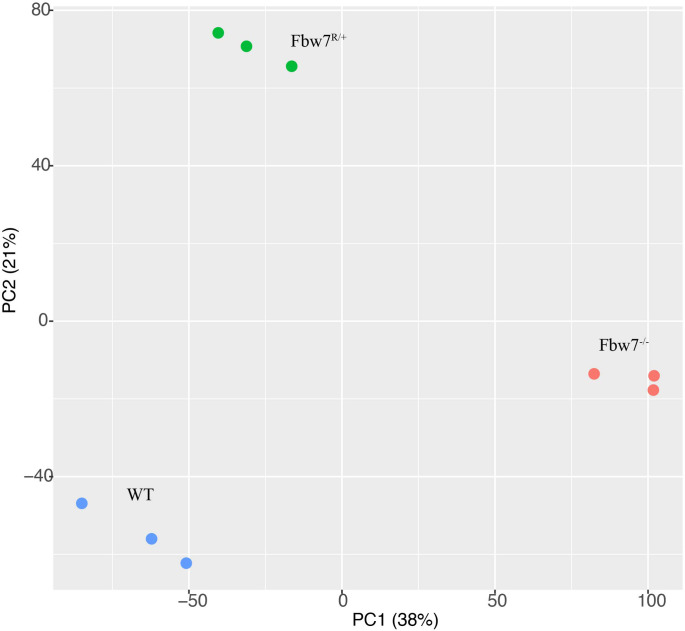
Figure 1—figure supplement 1. Principal component analysis (PCA) of RNA-Seq from Hct116 cells.

Figure 1—figure supplement 1.

Hct116 wild-type (WT), Fbw7−/−, and Fbw7R/+ samples separate by genotype. Replicates from each condition are clustered together.
Figure 1—figure supplement 2. Proliferation of Fbw7 mutant Hct116 cells.

Figure 1—figure supplement 2.

(A) Cell proliferation was monitored with an IncuCyte for 75 hr. Data are shown as mean ± SEM. Proliferation was measured at each time point normalized to percent confluence at time 0. Doubling time, WT 20.9 hr, Fbw7R/+ 24.9 hr, and Fbw7−/− 25.9 hr. (B) Flow cytometry analysis of DNA replication in Fbw7 mutant cells. Density plots of EdU versus DNA content (DAPI) in Hct116 cells. Single cells were identified by gating events on DAPI-H/DAPI-A. Cells were labeled with EdU prior to harvest and were later fixed and immuno-stained for flow cytometry. WT, wild-type.